Master Facility List
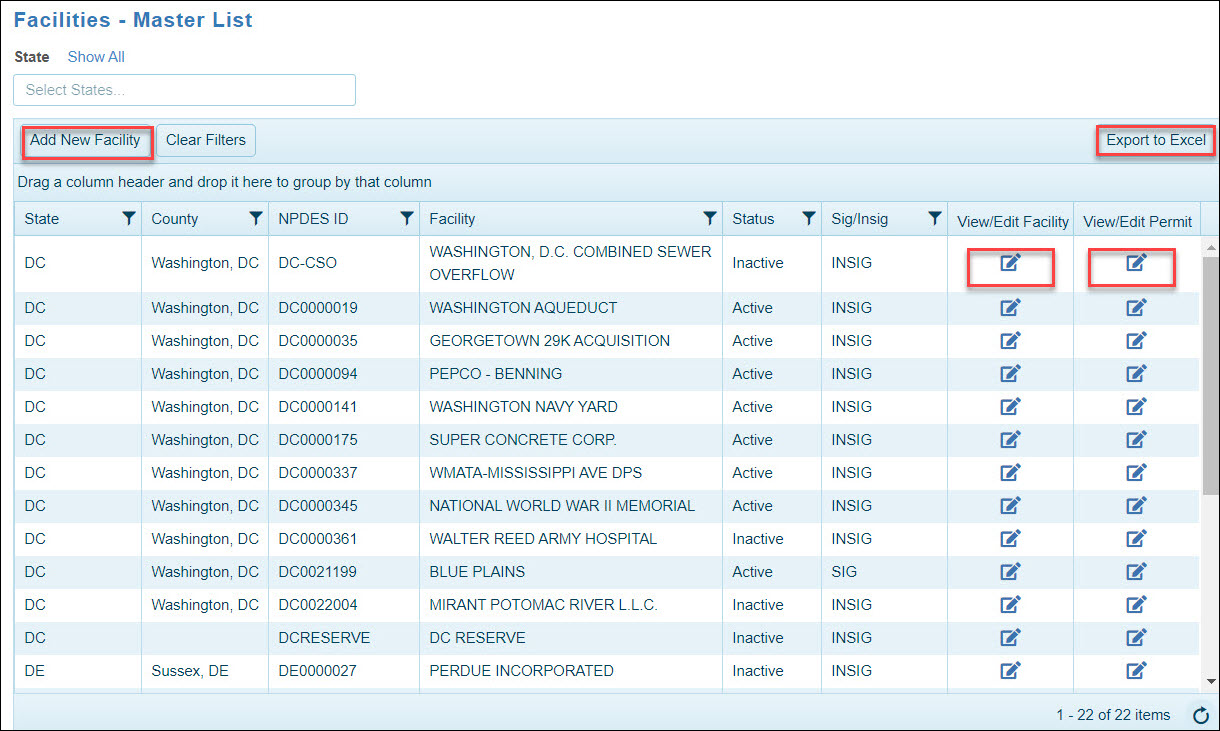
The user can access the Master Facility List by clicking on the Facilities link in the top banner.
The Master Facility List provides users with a list of facilities associated with their jurisdiction. The information displayed includes the state, NPDES ID, facility name, discharge type and active/inactive and significant/insignificant status.
From this page the user can add facilities, view or edit facility and permit data and export the list of facilities to Excel.
Facility List - Export to Excel
Users can export their facility list to Excel and then filter it, if desired, to create various subsets based on any of the following fields in the file.
| Column Heading | Column Heading | Column Heading | Column Heading |
|---|---|---|---|
| Facility Name | Perm Feature | Outfall Status | Facility Offline Date |
| State Abbreviation | Sig/Insig | SIC Code | Permit Status Name |
| NPDES ID | Facility Size | Latitude | Current Permit Expiration Date |
| County | Discharge Type | Longitude | |
| Location | Facility Status | Facility Online Date |
The file contains both a Facility and an Outfall Status column for clarification. By definition, at least one outfall must be Active in order for a facility to be considered Active.
Add/Edit Facility
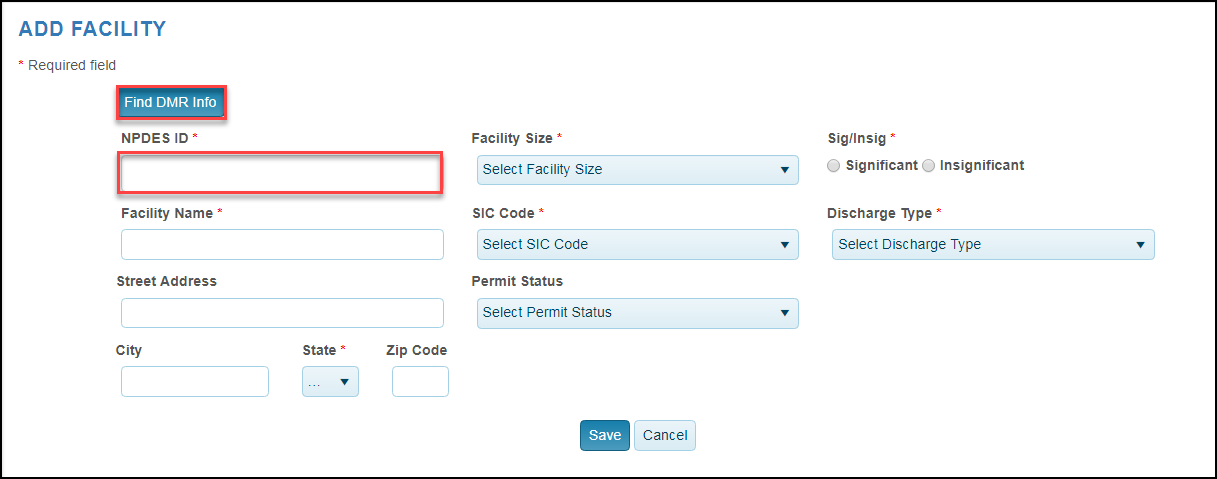
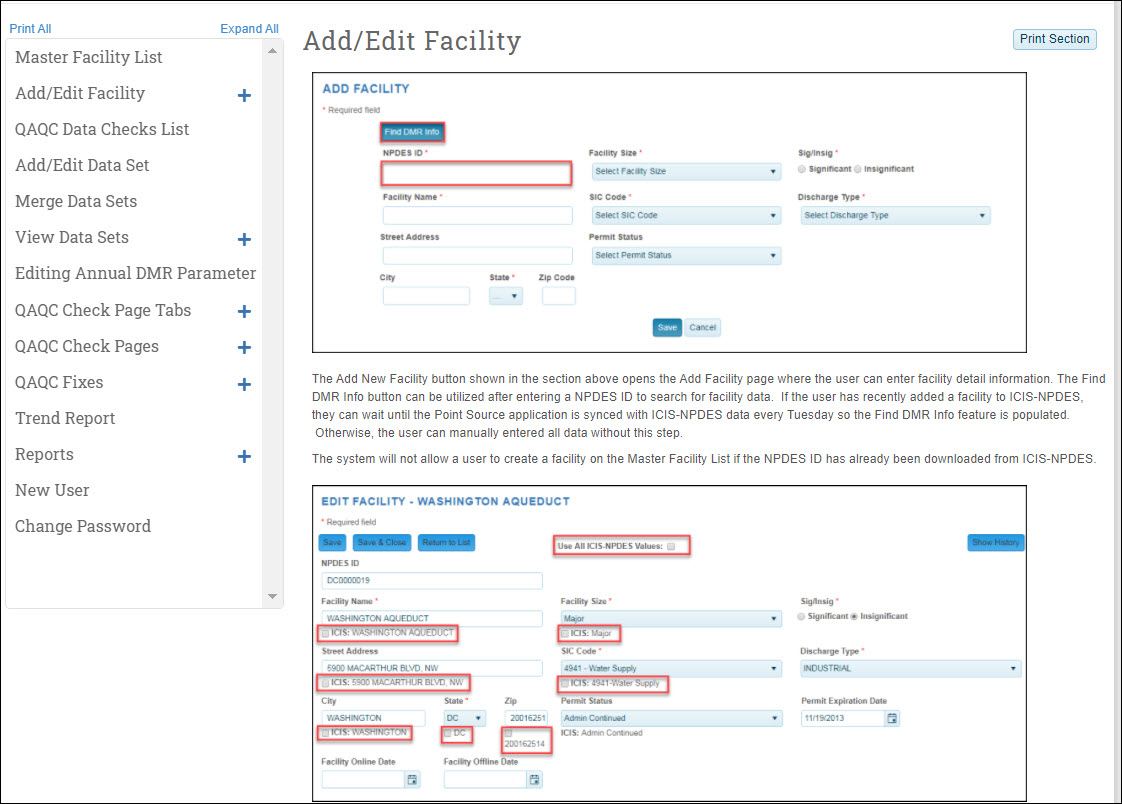
The Add New Facility button shown in the section above opens the Add Facility page where the user can enter facility detail information. The Find DMR Info button can be utilized after entering a NPDES ID to search for facility data. If the user has recently added a facility to ICIS-NPDES, they can wait until the Point Source application is synced with ICIS-NPDES data every Tuesday so the Find DMR Info feature is populated. Otherwise, the user can manually entered all data without this step.
The system will not allow a user to create a facility on the Master Facility List if the NPDES ID has already been downloaded from ICIS-NPDES.
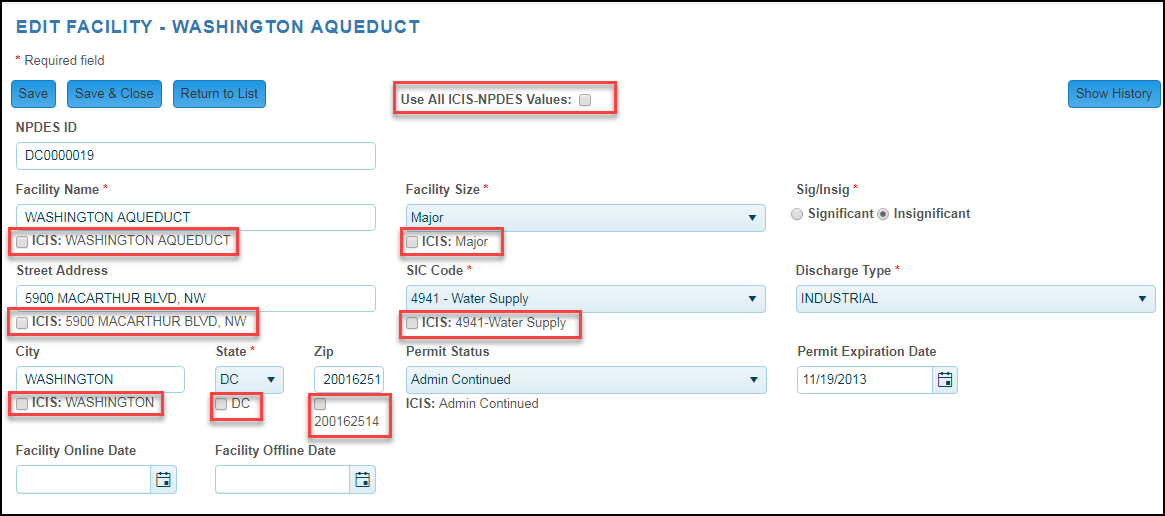
The View/Edit Facility link opens the Edit Facility page which contains three sections: facility details, outfall data and associated comments.
The ICIS checkboxes allow the user to update the facility detail data in the Point Source application using the data obtained from ICIS-NPDES downloads. The user can update specific fields or all marked fields with the Use All ICIS-NPDES Values checkbox at the top of the page.
Show History
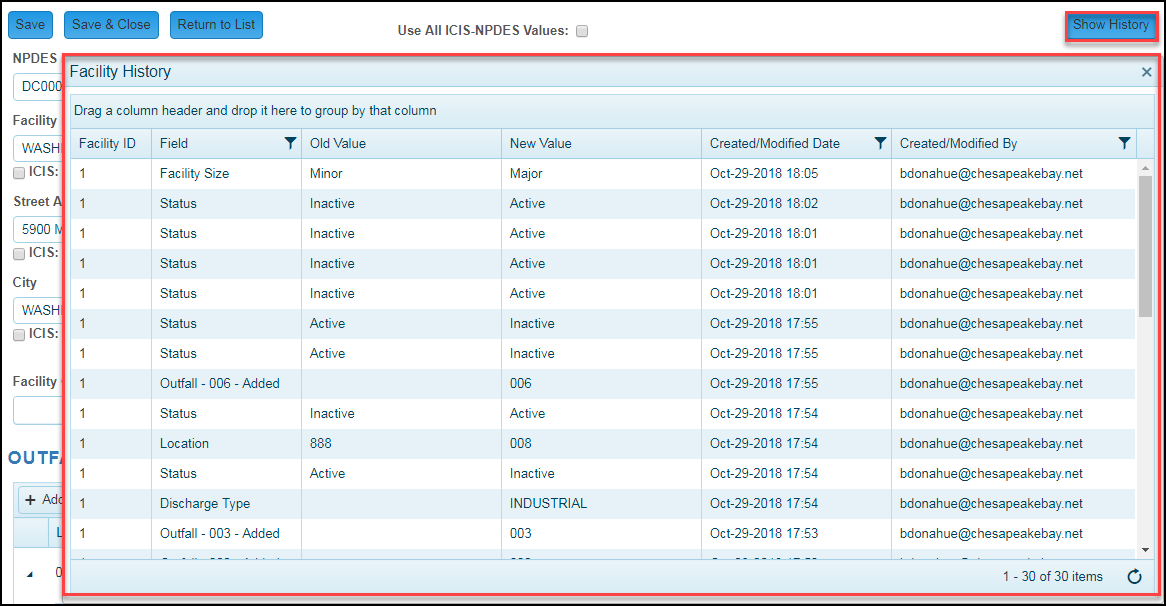
The Show History button displays the value changes made in the facility details section recording the values, dates and users that performed the action.
Outfall Information
The outfalls section contains information about the facility’s outfalls and associated permit features. The arrow next to each location expands to display any associated permit feature data.

.Permit Features
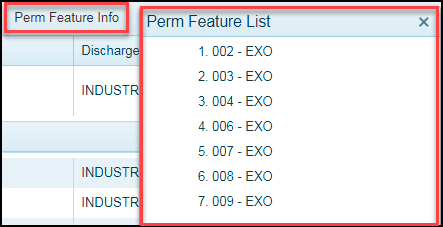
The Perm Feature Info button will display the permit feature data obtained from the DMR data which can be useful when creating new locations or permit features.
Location versus Permit Feature Guidelines on when to add a new location or a new permit feature to an existing location. Cleaning up the permit feature/location data is expected to reduce the amount of work required for submitting the Progress Report data.
Adding/Editing Location
Adding a new location (outfall) adds a distinct discharge point to that NPDES ID/facility. Data will be reported for ALL parameters for ALL 12 months for EACH facility location (though some of those data may include “No Discharge” events).
Adding a permit feature to an existing location (outfall) merges/summarizes the data reported for different parameters being discharge from ONE location (outfall). This will often occur when the requirements for parameter reporting are spread over multiple permit features.
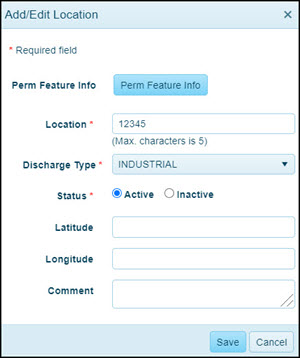
Both the Add Location button and outfall Edit link open the Add/Edit Location pop up where outfall detail data can be entered. At least one outfall must be Active in order for a facility to be considered Active. Historic outfall data must be maintained in the Point Source application in order to support the available Progress Reports so general users can only make an outfall Active/Inactive instead of allowing deletion.
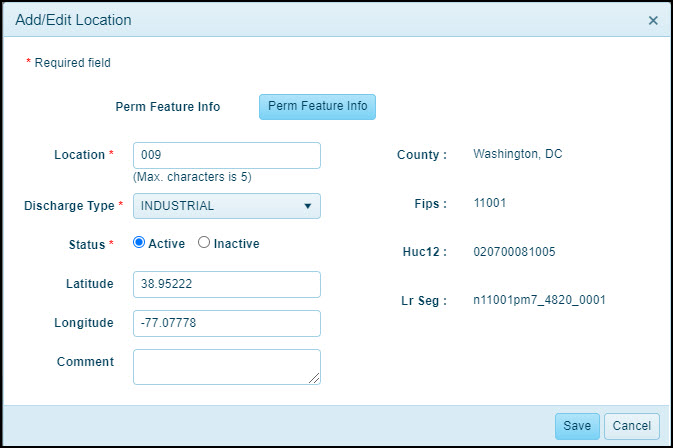
.
Using the Edit link for a location will display additional information including FIPS, HUC 12 and Land River Segment data..

Clicking the link in the Add Perm Feature column of an outfall expands the Perm Feature section so data can be added. Only the Perm Feature Number is required to complete the process. The user can edit or delete perm feature data as need.
Facility Comments

The Add Comment button in the Facility Comments section allows users to record pertinent information about the facility and the changes the users make over time. It can be used to connect facilities that change NPDES IDs, statuses or permit activities.
QAQC Data Checks List

An overview of the various QAQC Data Checks that will be performed on a data set can be viewed on Data Checks List page from the Data Set link in the top banner.
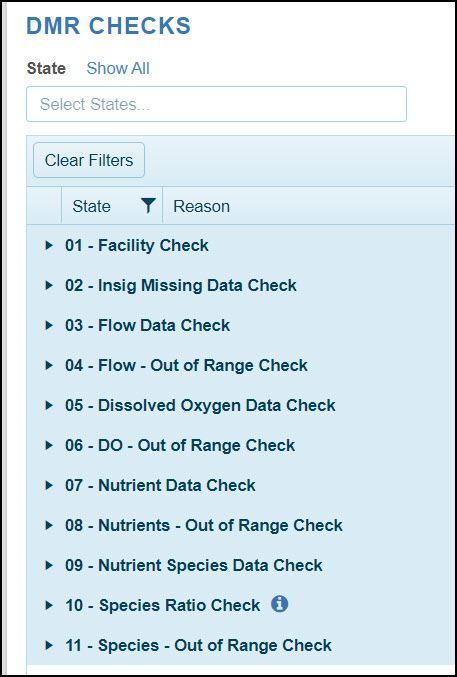
The QAQC Data Checks will be applied in the order (1-11) outlined on the QAQC Data Checks List page and will contain a combination of warnings and errors as shown in the expanded list. Only errors must be corrected in order to move a data set to the next level of data checks; edits can be made in response to warnings but are not required.
Add/Edit Data Set

The Data Set page can be accessed using the Data Set dropdown in the top banner.
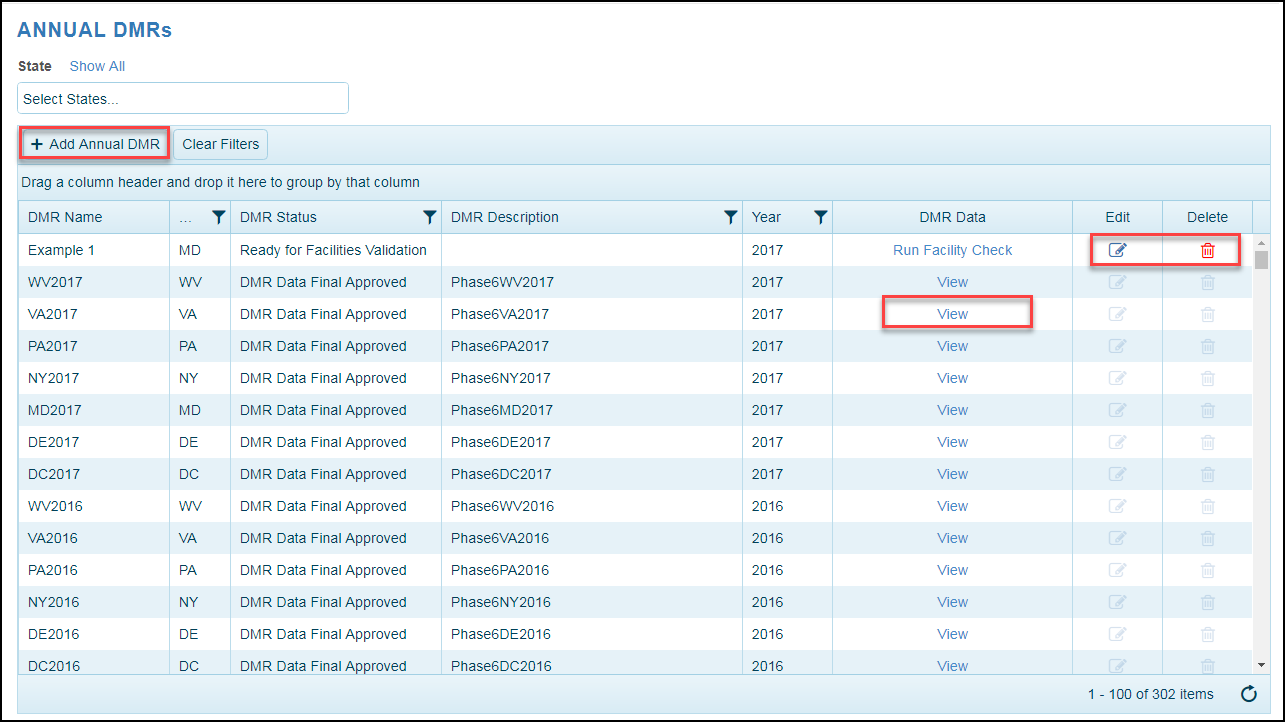
Users can create, edit and delete their own data sets from this page using the Add Annual DMR button and Edit and Delete links. Users can also access prior year Progress Reports using the View link and can export those files once they are opened.
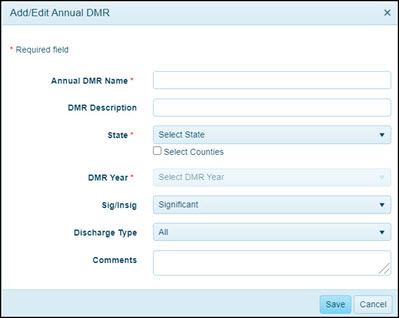
The Add Annual DMR button and the Edit DMR Data link both open the Add/Edit Data Set pop up window. Upon initial creation, the data set will be added to the grid on the page. The complete processing of a new data set will be outlined in the Data Set Processing Controls section below.
If the user elects to edit a data set at any time in the processing cycle using the Edit link, the data set will retain any changes made in the data set to that point but will return to the Run Data Set state for re-processing.
The Point Source database is updated weekly on Tuesday to reflect the latest data in ICIS-NPDES. Changes made in ICIS-NPDES after our update will not be reflected in the Point Source application until the following Tuesday.
New ICIS-NPDES data will not automatically overwrite data in an existing data set. For changes to fields in existing data sets that have been modified using the Point Source application, even re-running the data set will not overwrite these edits. A new data set would have to be created to capture the new data from ICIS-NPDES and the user would need to re-apply manual fixes for any outstanding issues.
Data Set Processing Controls

Data set processing controls are available on both the Data Set page and most QAQC Check pages. On the Data Set page, the controls are contained in the DMR Data column. After each QAQC Check level is processed, the user will need to use the Check link to access the resulting QAQC Check page to make fixes. Review the Data Check List to identify the order and types of warnings and errors generated by each QAQC Check level.
The View can be used at any time after the Run Data Set step to display the current data in the data set including any fixes that have been applied.
The easier option is to switch to the controls on the QAQC Check page after the Run Data Set step has been completed so users doesn’t need to return to the Data Set page in order to move to the next step in the process.
Merge Data Sets
The Merge Data Set link can be accessed from the Data Sets dropdown in the navigation bar.

Merge Data Set Page
Instructions on creating a merged data set are provided on the page using the Info icon next to the Create New Data Set title.

The user will need to create a new data set for the merge results. The Name, State and DMR Year fields are required while the Description and Comments fields are optional.
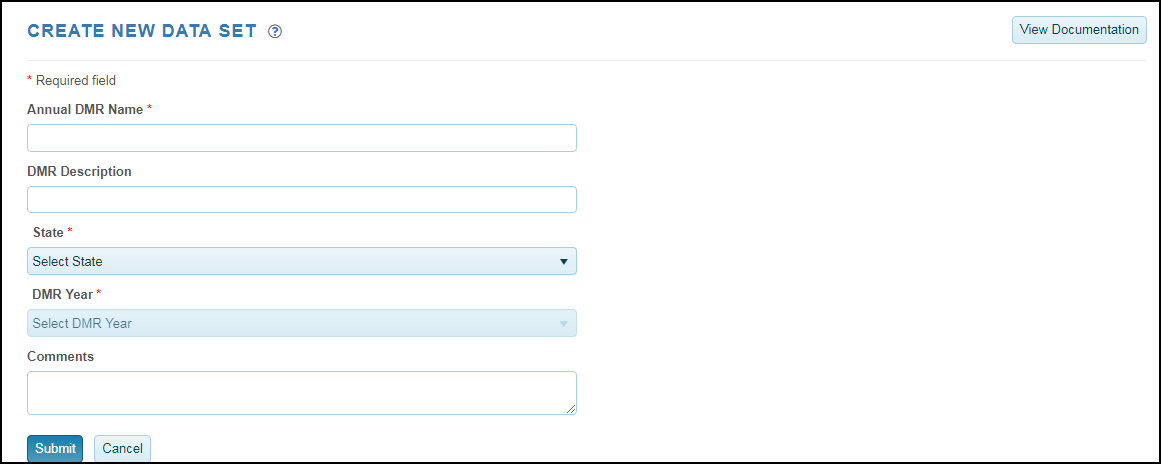
Once the required fields are completed, the page will expand and provide the user with a list of matching data sets that can be used for the merge. For the general user, the only data sets that can be merged are ones they created. Other roles will allow the user to merge data sets created for their state.
Only data sets that match the parameters and have the QAQC Complete status will be displayed in the Annual DMR list. The user can select a data set and use the arrow to move it to the Annual DMR Merge List. The first data set in the Merge List box and its values will be the basis for the merge. Subsequent data sets will be checked for unique facility records to be added to the merged results while duplicate records and values will be captured in the Merge Report.
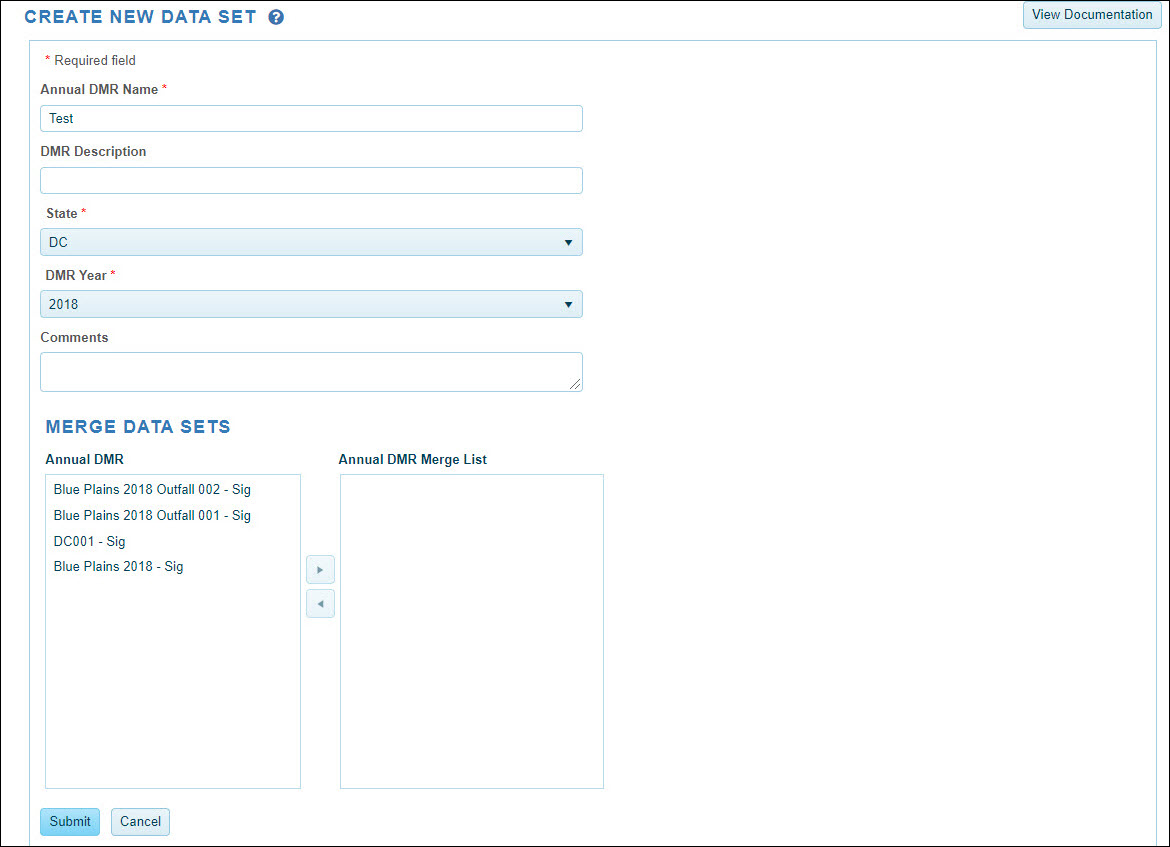
The user can change the primary data set for the merge by selecting a data set in the Annual DMR Merge List and using the drag and drop feature to move the items.
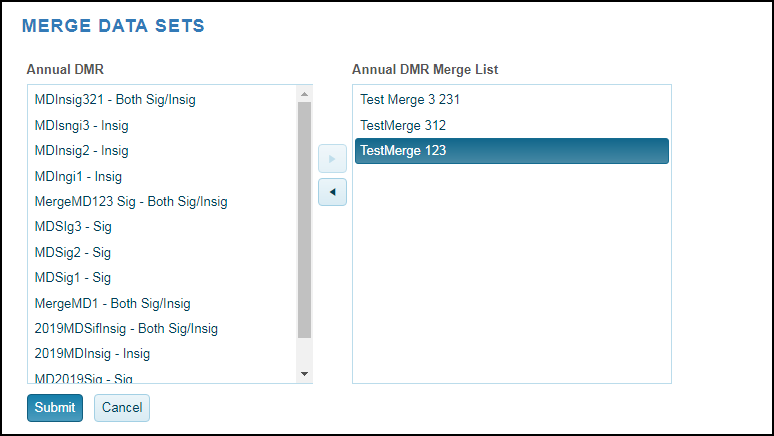
Clicking the Submit button will start the merge process and the user will be taken back to the Data Set Page. The new data set will display the Merge in Progress status which could take a while depending on the number of records being processed and whether another merge is also being performed.

Once completed, the data set will display a QAQC Complete status and the View link will appear in the DMR Data column. The new combined data set can be viewed in the application or exported to an Excel file.

Merge Report
Clicking the View link will open the data set page with an additional Merge Report link. A trend Report can also be run on the merged data set.
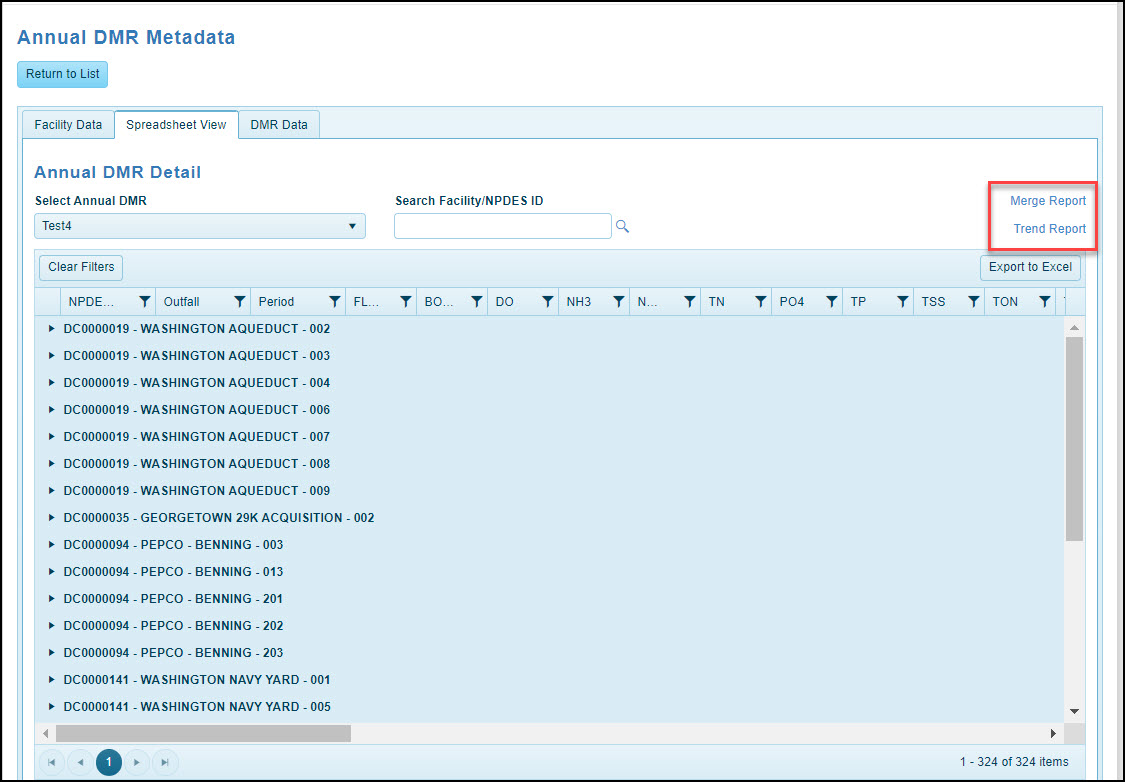
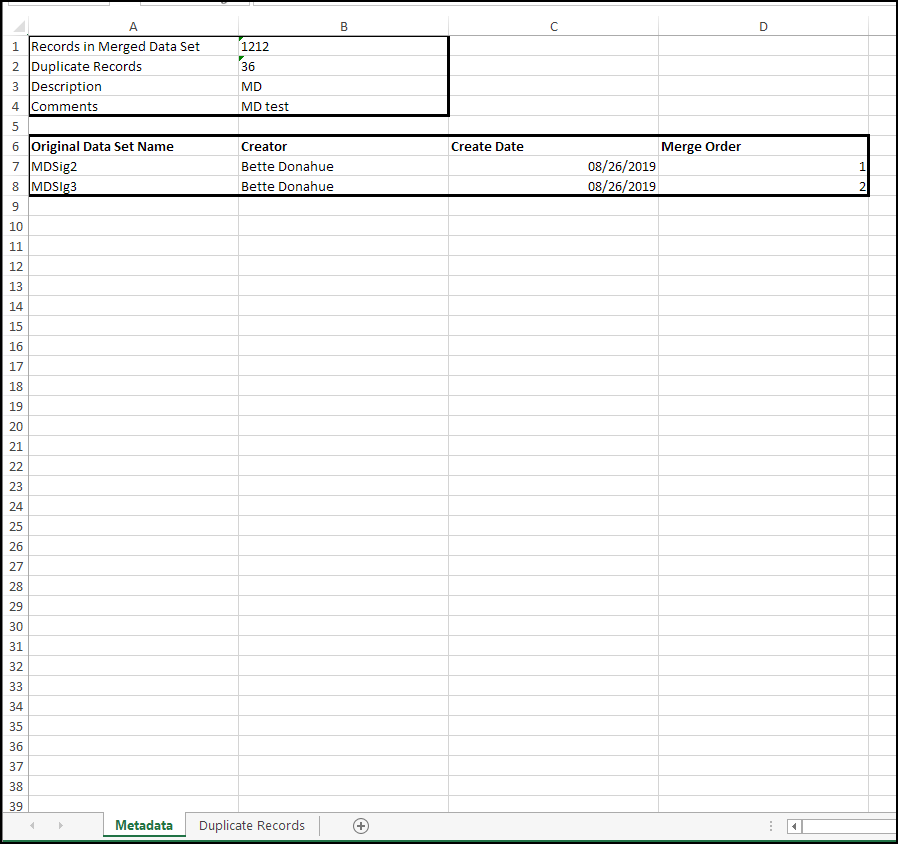
The Merge Report will have two tabs: Metadata and Duplicate Records. The Metadata Tab will provide the following information:
- Number of records in the merged data set
- Number of duplicate records
- Data set description
- Data set comments
- The original data sets and data set order used in the merge.
- Original data set metadata including creator and date created.
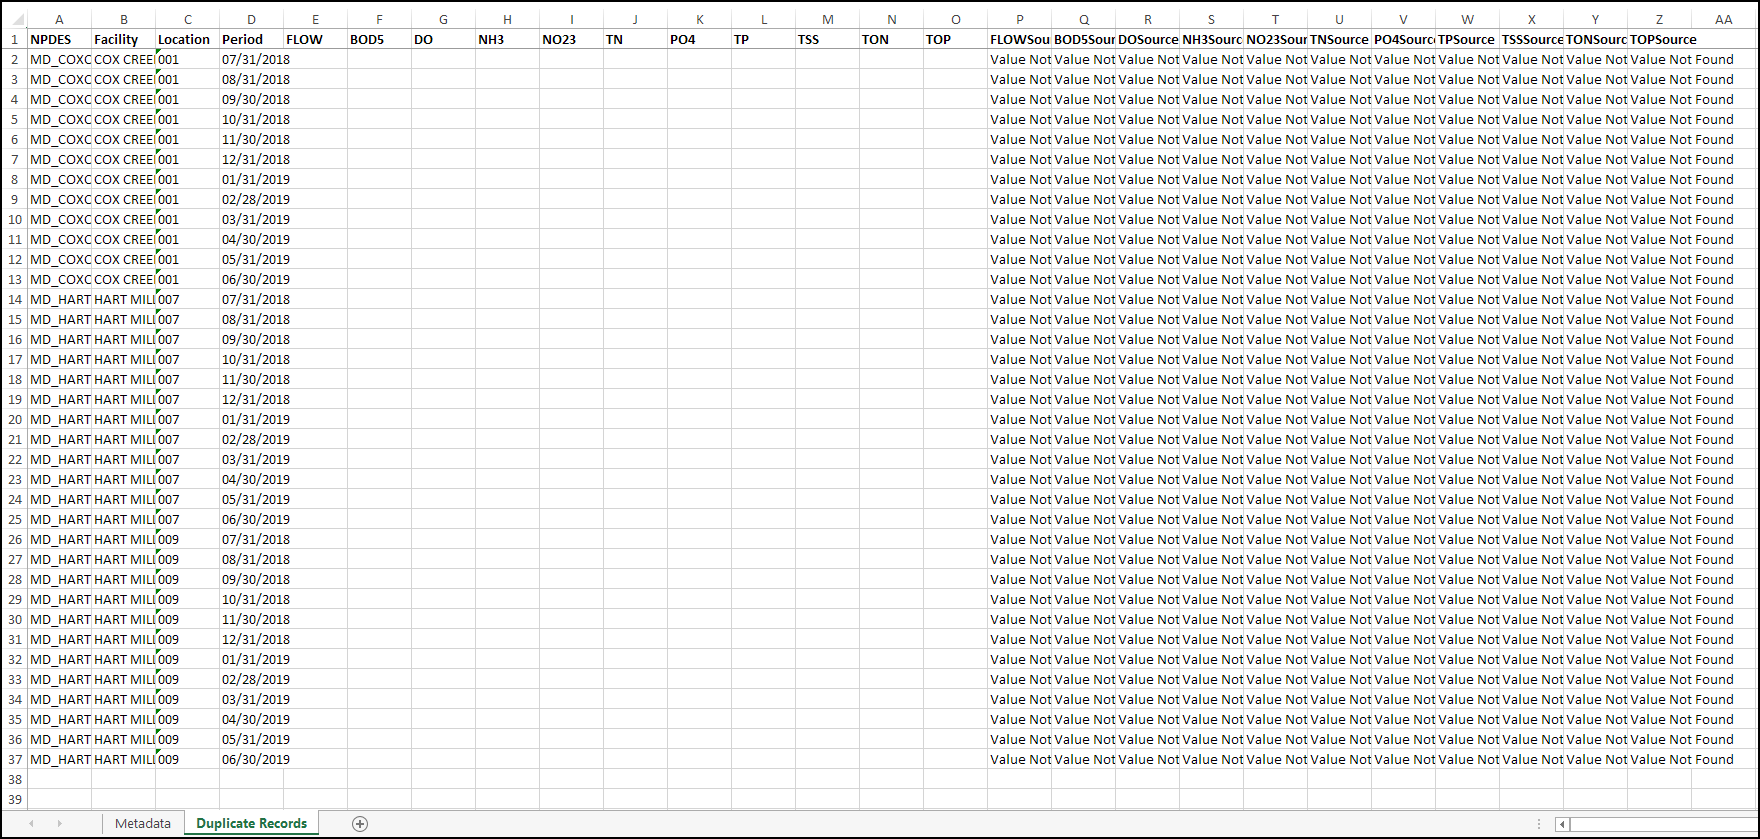
The Duplicate Records Tab will list the records that were excluded from the new combined data set based on the data set order selected during the merge process.
View Data Sets

Data for the View link is not fully populated until after both the Facility Check and Run Data Set steps have been completed. The link opens the Annual DMR Metadata page which consists of three tabs: Facility Data, Spreadsheet View and DMR Data.

Users can move between the View tabs of different data sets by using the Select Annual DMR dropdown at the top of each page.
Facility Data Tab
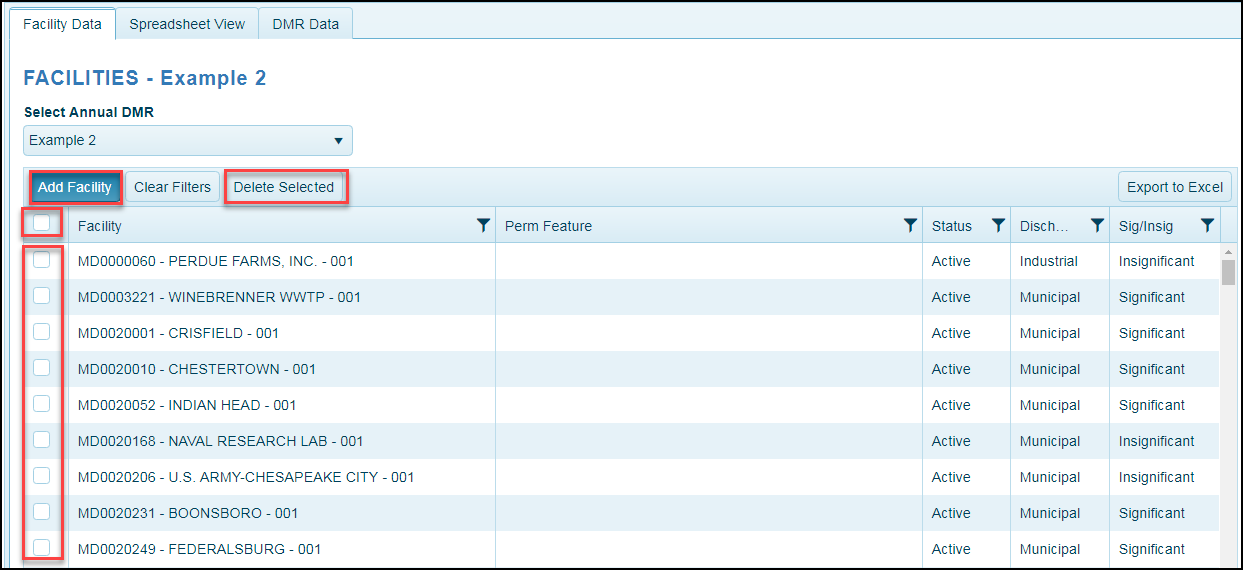
The Facility Data tab provides a list of the facilities associated with the data set. Only active facilities are included in Point Source data sets which is why it is important to update the information on the Master Facility List before creating a data set to make it as clean as possible.
Adding/Deleting Facilities for Data Sets
Users can add or delete facilities from the data set on this tab. This is a useful feature if facilities were forgotten in the original data set or a smaller subset is desired based on facility size, etc.
The addition of facilities included in the data set can be made with minimum impact. While the data set will need to revert to the Run Data Set step after the change, all of the fixes already applied to the original data set will remain. Deleting facilities does not revert the data set’s progress since the action creates a subset of the original data.
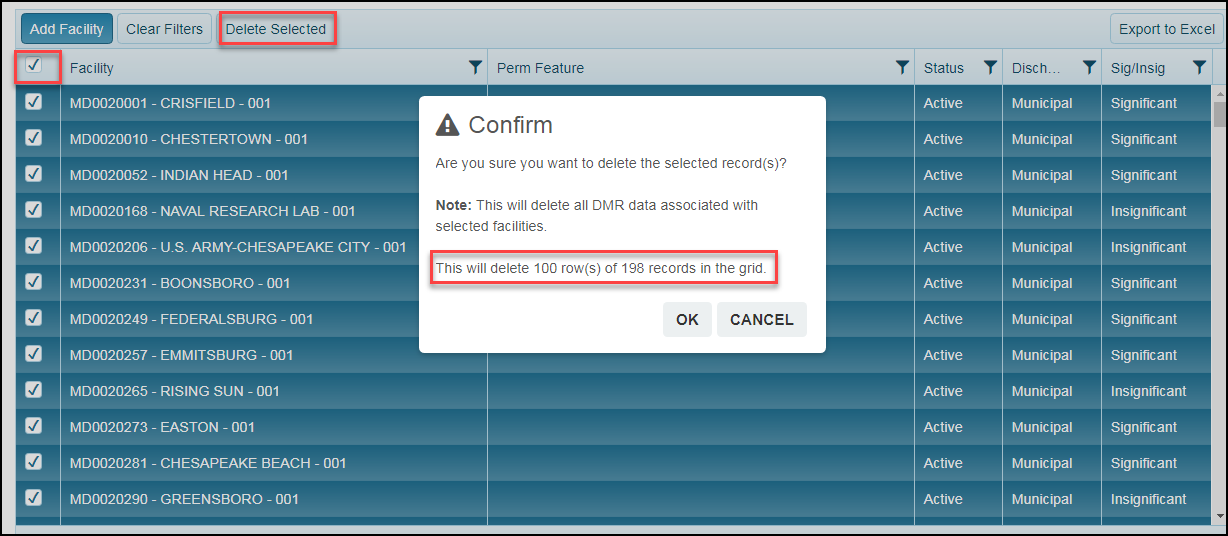
Deleting options include selecting specific facility checkboxes and then the Delete Selected button. The alternative is to use the checkbox next to the Facility header which will select all the facilities on the current page. In this example, the 100 facilities included on the current page were deleted.
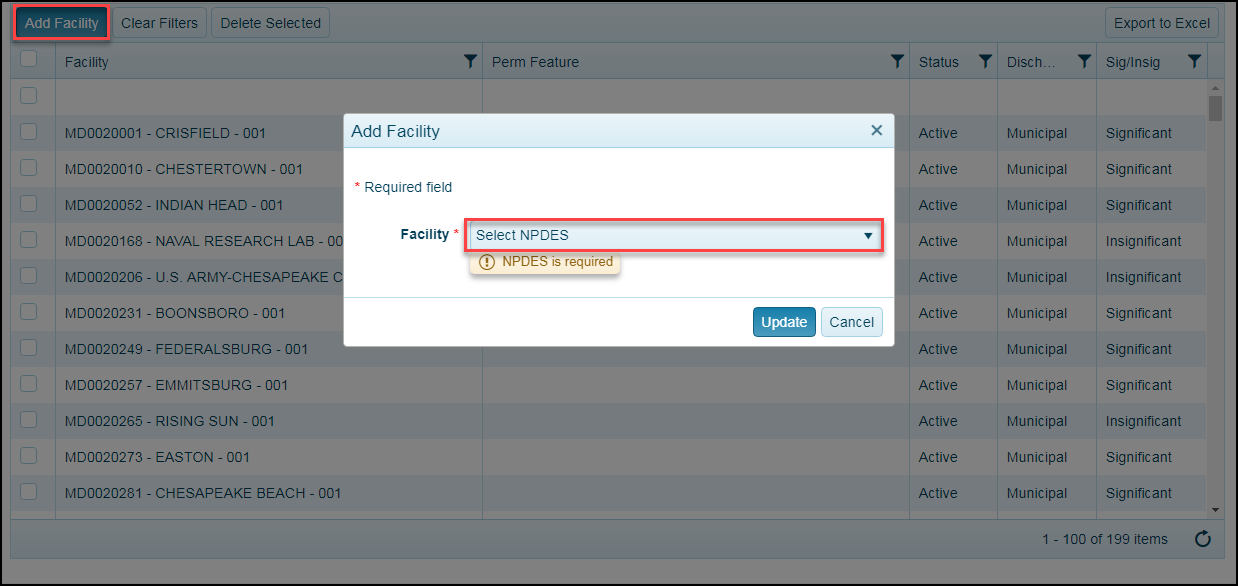
Adding facilities to a data set requires the use of the Add Facility button and then selecting the new item from the dropdown of available facilities (which must be active in the Master Facility List). When the user returns to the Data Set page, the data set will be returned to the Run Data Set step but any fixes applied to original data set will remain.
Export Data Set Facility List
Users can download the facility list for the data set. Information includes:
| Column Heading | Column Heading | Column Heading |
|---|---|---|
| Facility Name (facility name is a combination of facility name and outfall number) | Perm Feature | Sig/Insig |
| Status | Discharge Type |
A review of the data set facility list is beneficial because it provides a comprehensive list of permit features associates with each outfall.
Spreadsheet View Tab
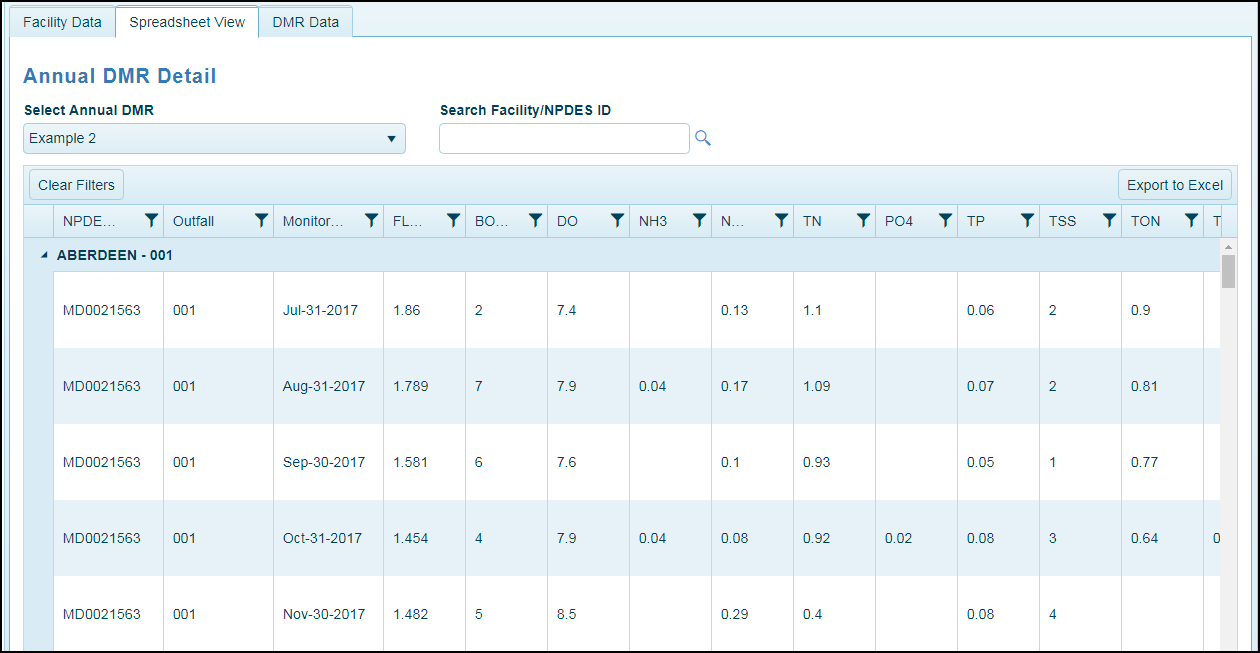
Reviewing the Spreadsheet View Tab after the Run Data Set step allows the user a view of the data pulled from ICIS-NPDES. This data is updated after each fix and can be accessed at every QAQC Check following the Run Data Set step from the Data Set page.
Data includes values for all reported and fixed parameters as well as the source of each data item. Comments will include data captured from ICIS-NPDES (NODI codes), calculations performed on parameters by the application and fixes implemented from fix uploads, etc.
DMR Data Tab
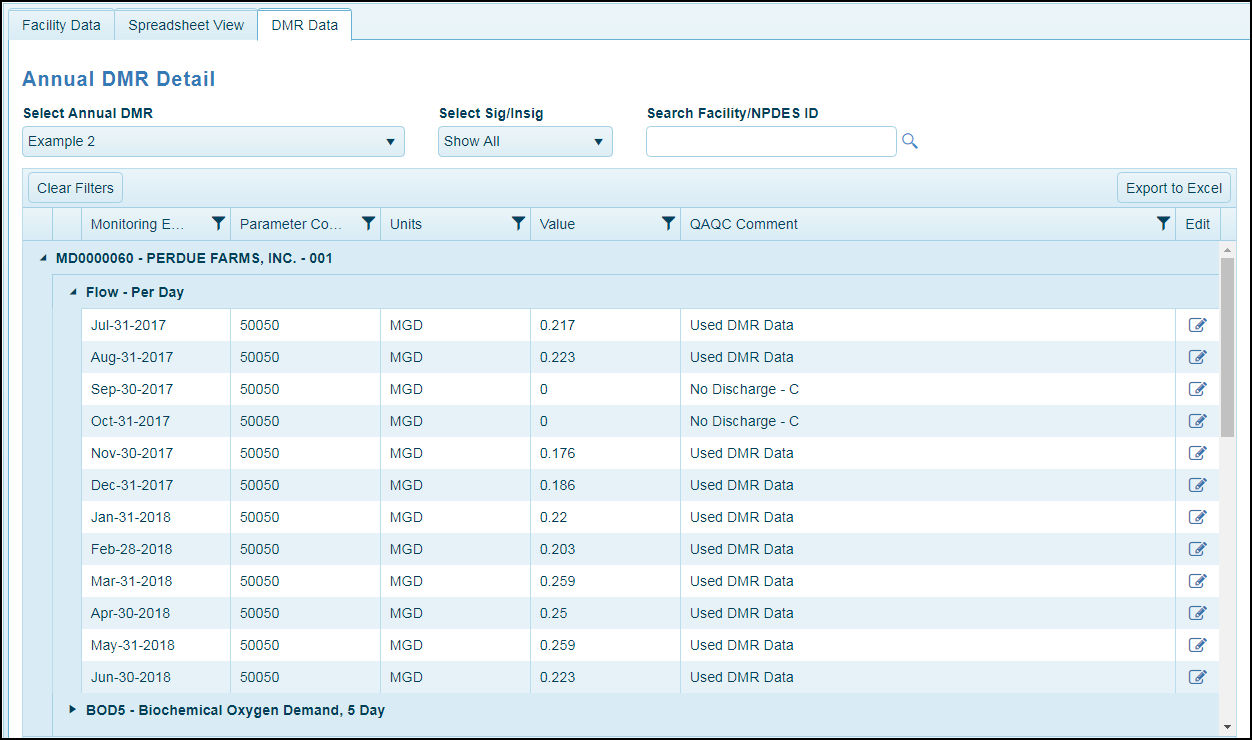
The DMR Data Tab presents the data in a different view with additional information including Parameter Code, Units and QAQC Comment.
Editing Annual DMR Parameter

Users will be able to review values downloaded from ICIS-NPDES, add values in the data set that were missing from ICIS-NPDES and adjust species values using stoichiometry equations in the Point Source application. These changes are only within the data set and do not affect the data maintained in ICIS-NPDES.
Under the data set’s View link, DMR Data tab, users can edit all values in the data set including those impacted by the QAQC data checks, alternatives to the options provided in the Stoichiometry fixes as well as values downloaded from ICIS-NPDES that pass QAQC data checks.
The Edit link for a specific value opens the Edit DMR Data View pop up where the value and QAQC comment can be entered.
One-Step File Upload Option for Editing Values
The user can edit all values in the data set at once under the View link once the Run Data Set step has been completed.
Use the Export to Excel button to download the data set in a protected spreadsheet. Certain columns containing the values’ metadata (facility, outfall, month, etc.) are locked and no rows may be added or removed from the file. The missing data is color coded blue to make it easier to locate but all values can be edited as well as the associated comments. If no comments are manually entered for the edits, the system will add Manual Override to the comment field by default.

The user can access this option throughout the QAQC check process by returning to the Data Set page and using the View link. Each time a one-step file is uploaded, the data set will be reverted to the Run Flow Data QAQC check state so all checks will need to be run again.
QAQC Check Page Tabs

The QAQC Check pages can be accessed using the Checks link on the Data Set page initially.
Data Set Processing Controls on Check Pages
They are also available on the QAQC Check pages after the Run Data Set step has been completed. Review the Data Check List to identify the order and types of warnings and errors generated by each QAQC Check level.
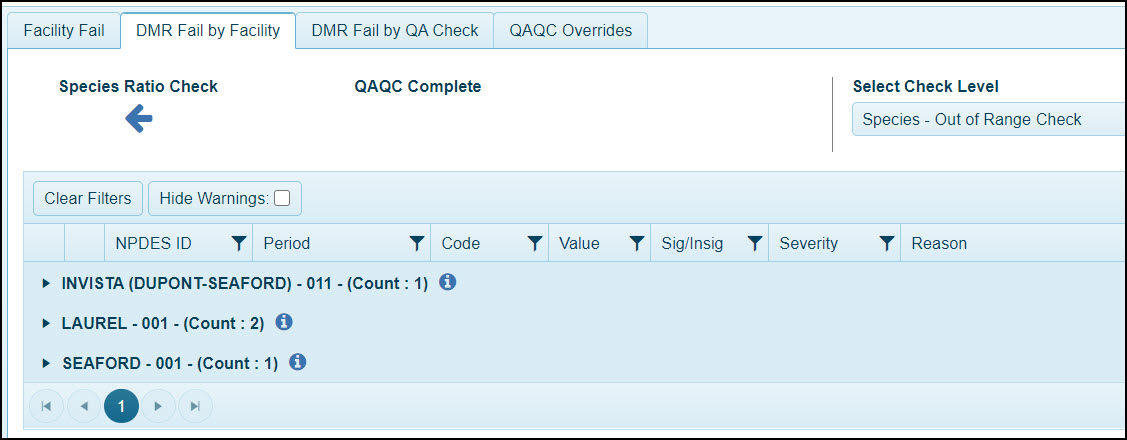
All of the parameter Check pages contain 3 tabs: Facility Fail, DMR Fail by Facility and DMR Fail by QA Check as shown in the image above.
Facility Fail Tab
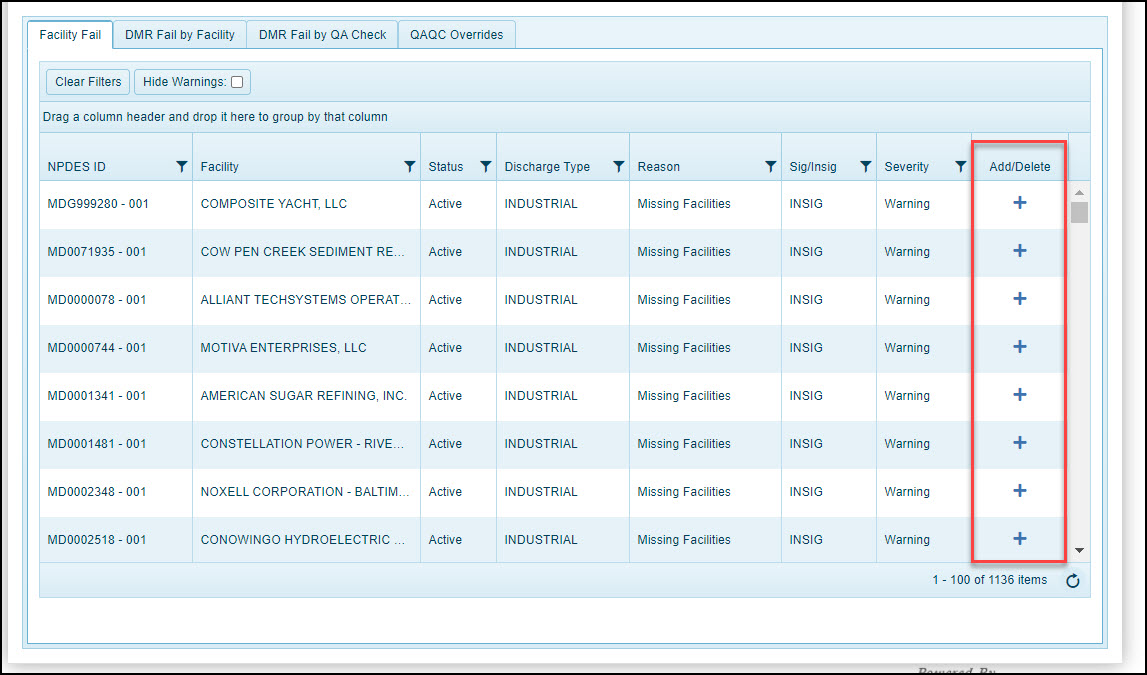
The Facility Fail tab consists of a list of facilities that are either new or missing when compared to the equivalent records from the previous year. Users can use the Add and Delete icons to edit the facilities contained in the data set. Only facilities identified as new or missing can be added/deleted from this page. This tab remains the same on all the QAQC Check pages.
Currently the facility check will utilize all facility data (Sig and Insig) for comparison which may result in some false positive results.

The warnings and errors for each QAQC Check page can be reviewed on the Data Checks List.
DMR Fail by Facility Tab
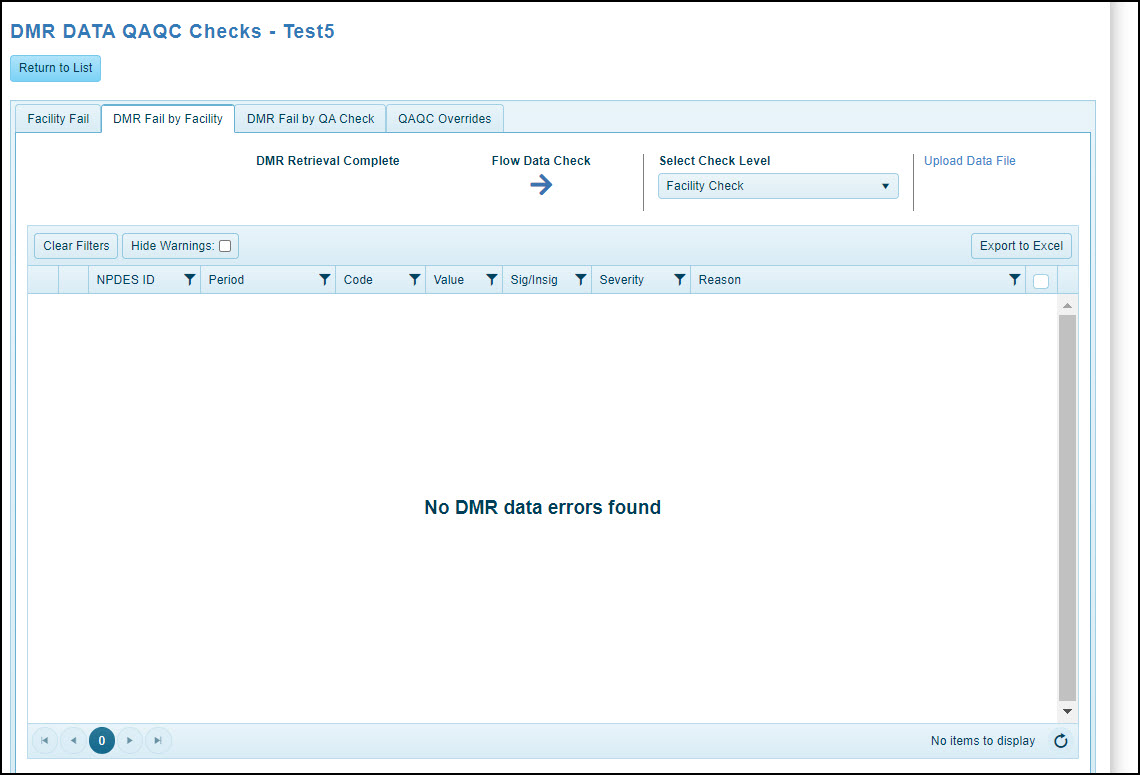
The DMR Fail by Facility Tab will change depending on the QAQC Check level being reviewed. It is grouped by facility and then parameter. The monitoring period, parameter code, value, sig/insig, severity and fail reason are also provided.
The grid can be filtered by column or using the Hide Warnings checkbox. The QAQC Check level warnings and errors can be downloaded using the Export to Excel button.
Fix options including file upload are available and will be discussed in a separate section. Users can move forward and backwards through the checks using the controls and Check levels previously completed can be accessed utilizing the Select Check Level dropdown.
Facility Information Button
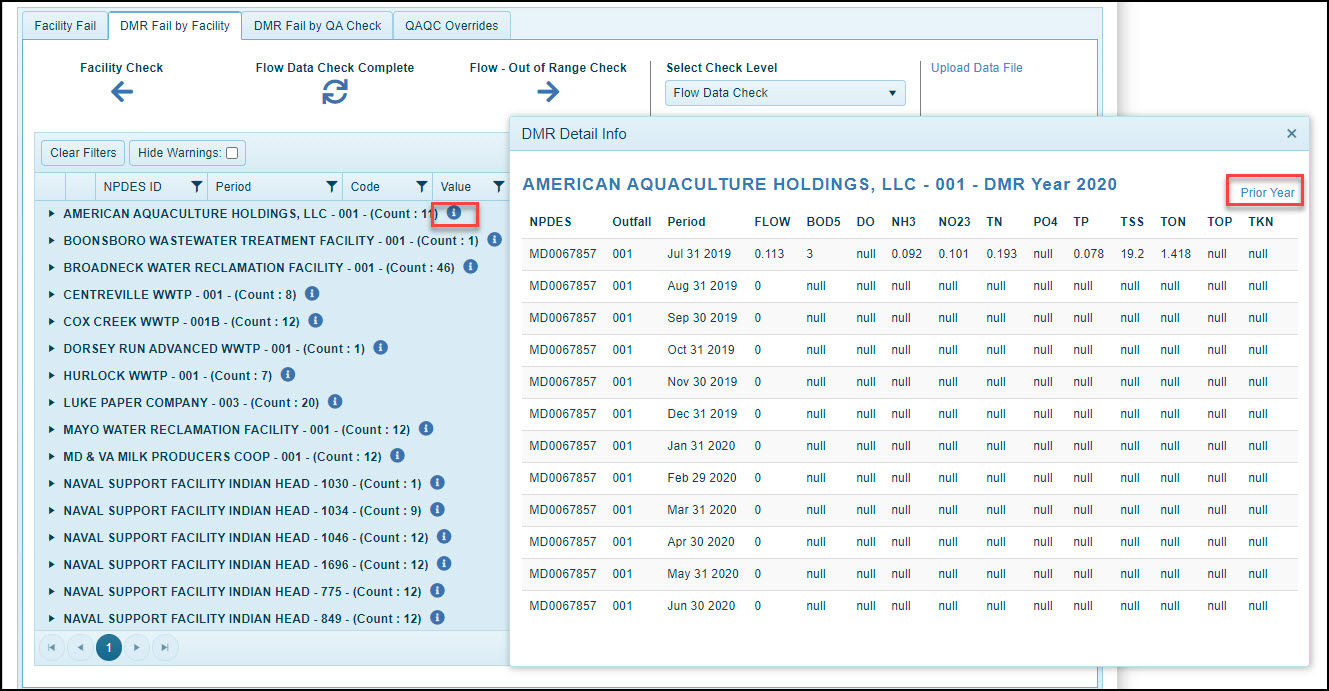
The DMR Detail Info icon next to each facility name is a useful resource displaying all of the facility’s data while determining the action required to fix the errors found. The button is available on both the DMR Fail by Facility and DMR Fail by QA Check tabs and includes a Prior Year link at the top right to also display the prior year data if available. Warnings can be fixed but are not required before progressing to the next QAQC Check level. The DMR Detail Info will update after each fix is completed so it will reflect the current data at each QAQC Check level.k
DMR Fail by QA Check Tab

The DMR Fail by QA Check Tab will change depending on the QAQC Check level being reviewed. It is grouped by check warnings and errors. The facility name, NPDES ID, monitoring period, parameter code, value, sig/insig, and severity are also provided.
The grid can be filtered by column or using the Hide Warnings checkbox. The QAQC Check warnings and errors can be downloaded using the Export to Excel button.
Fix options including file upload are available and will be discussed in a separate section. Users can move forward and backwards through the checks using the controls and check levels previously completed can be accessed utilizing the Select Check Level dropdown.
Exporting QAQC Check Levels
Users can export from a file from the DMR Fail by Facility and DMR Fail by QA tabs of any of parameter QAQC Check levels (3-10). Files will contain the following columns: Facility Name, Sig/Insig, NPDES ID, Monitoring Period, Parameter Description, Reason, Units, Value and QAQC Comments.
QAQC Check Pages
Facility Data

Errors and warning displayed on the Check level are displayed above.
Insignificant Missing Data

The Insignificant Missing Data check will only be performed on data sets that include insignificant facilities. If an insignificant outfall is missing all parameter data for every month, the user will be given the ability to complete the data set by selecting the previous year's data.
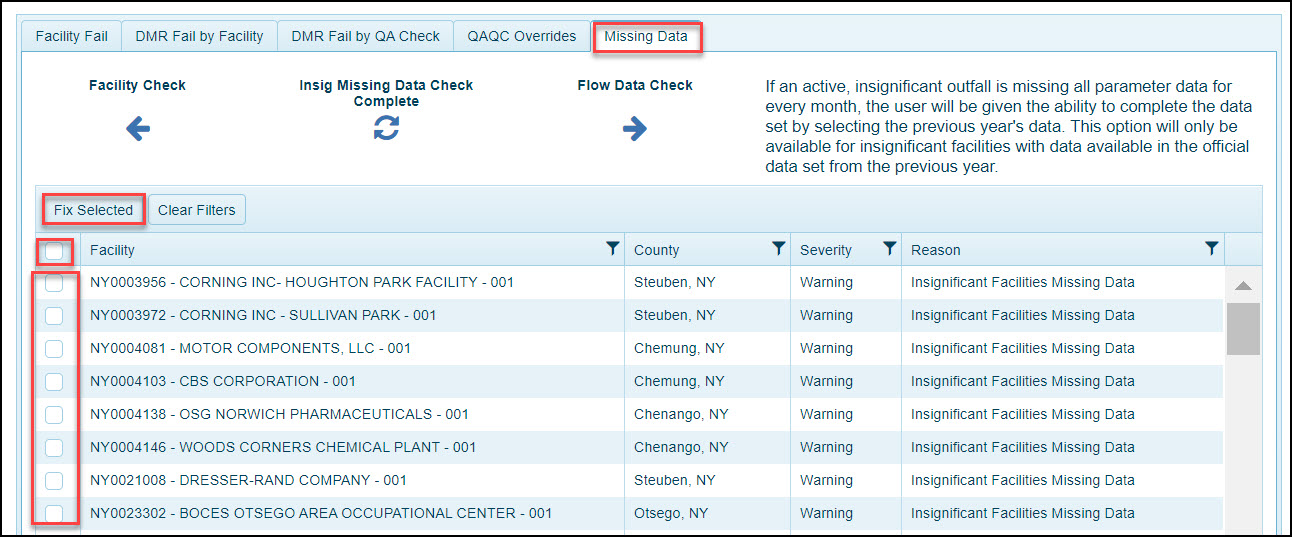
The Missing Data tab will only display those insignificant facility outfalls that are eligible for this fix. The user can elect to either update individual outfalls by selecting specific checkboxes or the top checkbox which will update all outfalls on the page at once.
Flow Data
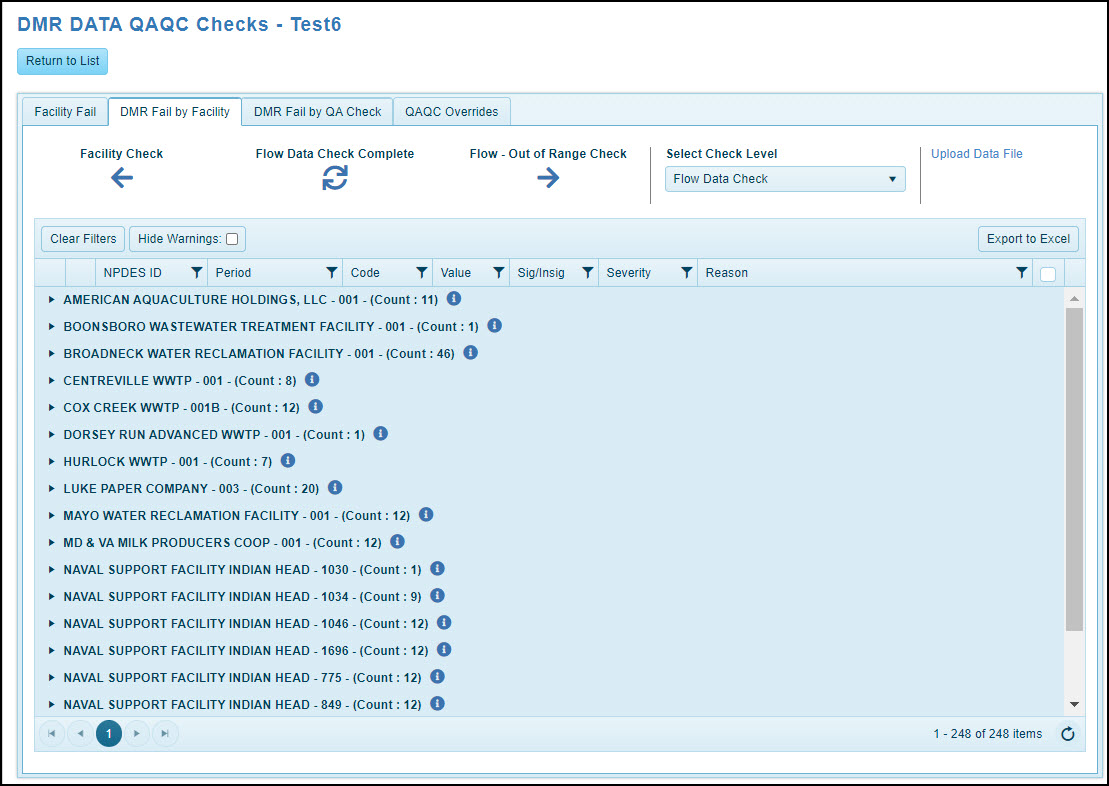
The Flow Check level contains an additional Fix option (Inactive Flow Month) which can only be applied to flow records. The Check level errors and warning for Flow and ”Species Value Exists for No Flow” records are shown below.

Flow - Out of Range
The Flow – Out of Range Check only contains warnings as shown below.
.
Dissolved Oxygen
The Dissolved Oxygen Check contains both errors and warnings for both DO and BOD5 as shown below.

DO - Out of Range
The DO – Out of Range Check only contains warnings as shown below.

Nutrient Data
The Nutrient Check contains both errors and warnings for TN, TP and TSS as shown below.
.
Nutrients - Out of Range
The Nutrients – Out of Range Check only contains warnings for TN, TP and TSS as shown below.
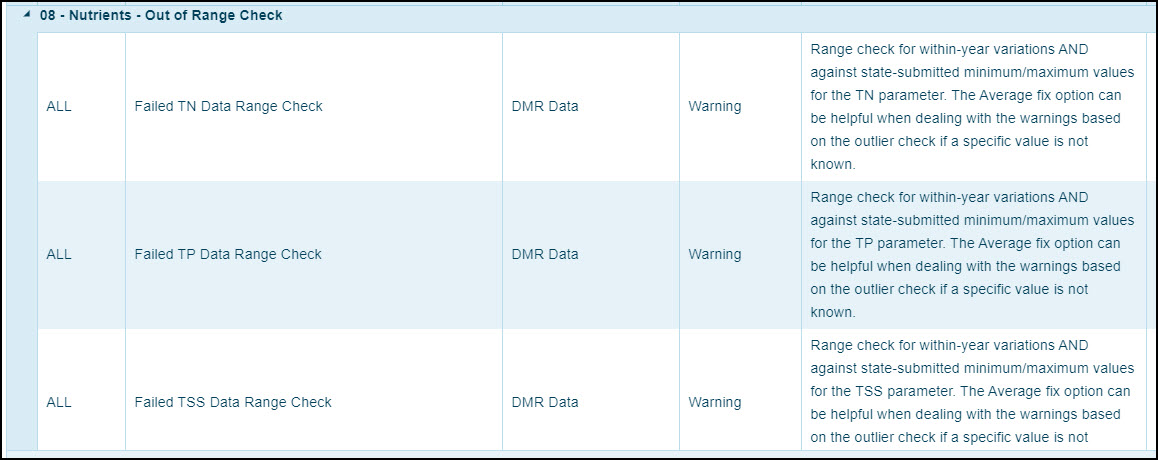
Nutrient Species
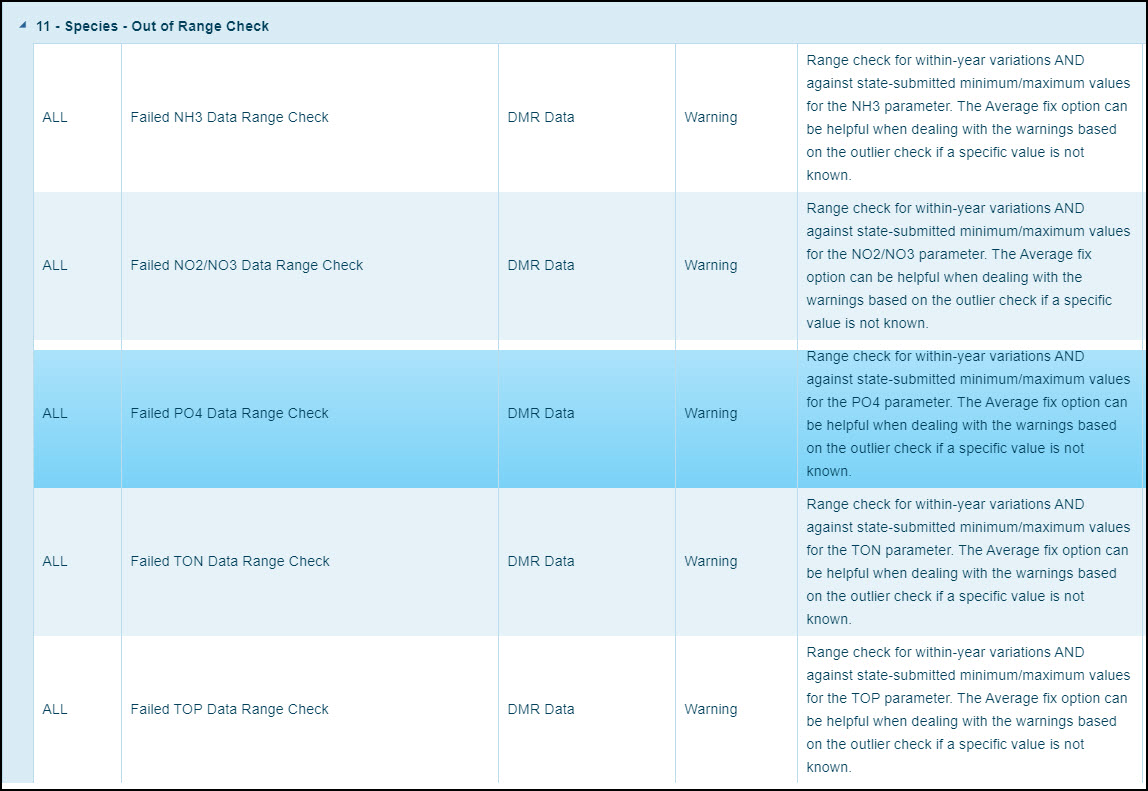
Errors and warning for NH3, NO2/NO3, PO4, TON, TOP are displayed on the Check level as shown below. Fix the NH3, NO2/NO3 and PO4 records first because the grid will automatically update and the fix might resolve the issues for TON and TOP records on the page.

Species Ratio
The Species Ratio Check level contains two Fix options, Adjust Pollutant Value and Adjust Species Proportion which can only be applied to TP and TN records. Only TN equations not including TKN (TKN + NO2/NO3 = TN) can be fixed using the TN Adjust Species Proportion fix.
The errors and warning displayed on the Check level are shown below.

Species - Out of Range
The Species – Out of Range Check only contains warnings as shown below.
QAQC Fixes
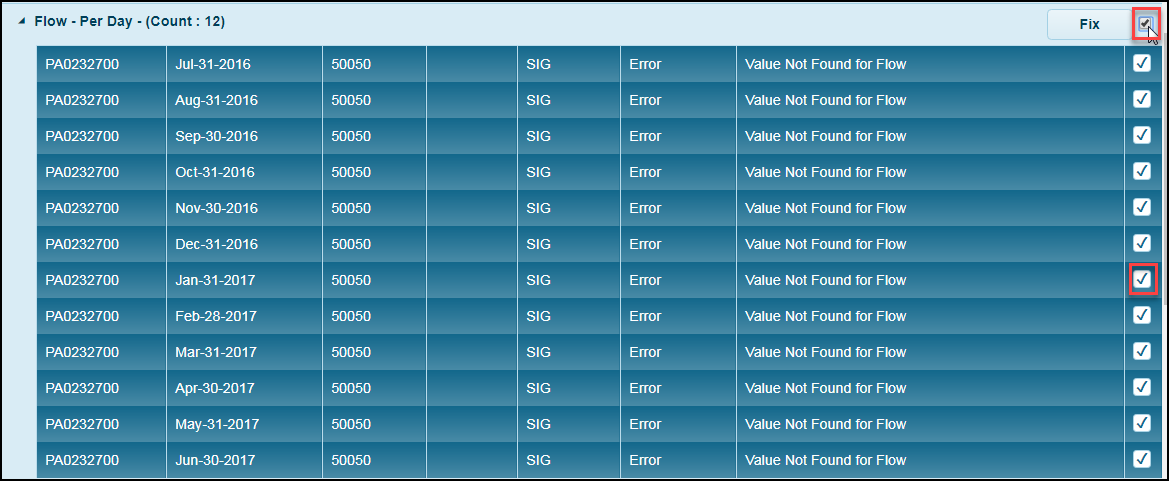
The user can select individual error checkboxes to correct records or use the checkbox next to the Fix button to select the entire group. Once a selection is made the Fix button opens the default User Submitted Value fix pop up. A value and comment are required for User Submitted fixes.
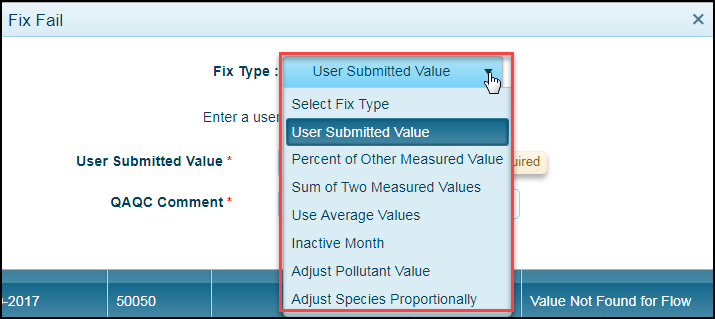
The user can select different fix options listed in the Fix Type dropdown on the pop up. Some fix options can only be used on specific check levels and parameters.
| Fix Options | Fix Options | Fix Options |
|---|---|---|
| User Submitted Value | Use Average Values | Adjust Species Proportionally |
| Percent of Other Measured Value | Inactive Flow Month (only Flow on Flow Check level) | |
| Sum of Two Measured Values | Adjust Pollutant Value |
When to Apply the Fixes
An outline of which fix options can be applied on each data check is provided in the table below.
| Flow / Flow Out of Range | Dissolved Oxygen / DO Out of Range | Nutrient / Nutrient Out of Range | Nutrient Species / Nutrient Species Out of Range | Species Ratio | |
|---|---|---|---|---|---|
| Adjust Pollutant | N/A | N/A | N/A | N/A | X |
| Adjust Species Proportionally | N/A | N/A | N/A | N/A | X |
| Difference of Two Measured Values | X | X | X | X | N/A |
| Inactive Month | X | N/A | N/A | N/A | N/A |
| Percent of Other Measured Value | X | X | X | X | N/A |
| Sum of Two Measured Values | X | X | X | X | N/A |
| Use Average Values | X | X | X | X | N/A |
| User Submitted Value | X | X | X | X | N/A |
A detailed description of each of the available fixes is provided in the next section. The QAQC Check Pages section lists the various errors and warning that can be fixed on each page.
User Submitted Value
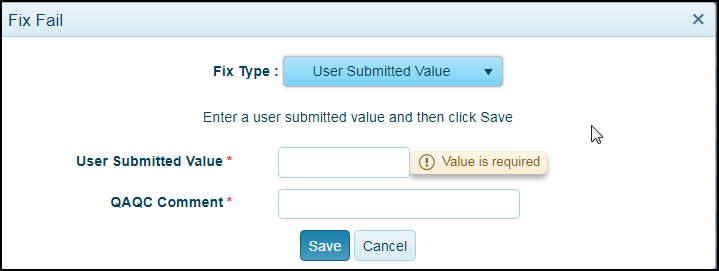
The User Submitted Value option requires a value and comment be provided. This option can be applied to all of the data checks except Species Ratio.
Percent of Other Measured Values
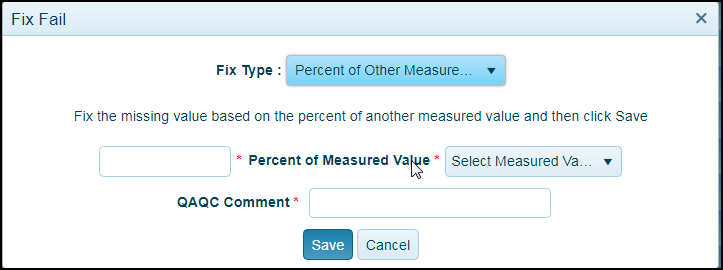
The Percent of Other Measured Value option requires a percentage, measured value (parameter) and comment to be entered.
Sum of Two Measured Values
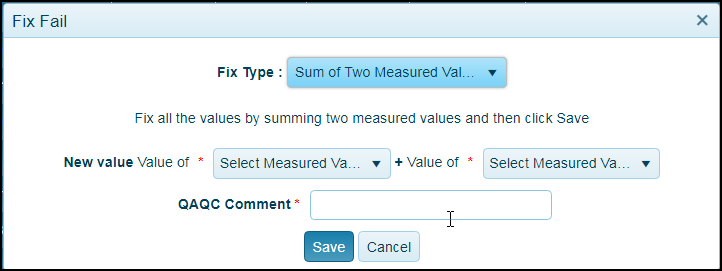
The Sum of Two Measured Values option requires the user to select two measured values (parameters) and add a comment.
Use Average Values
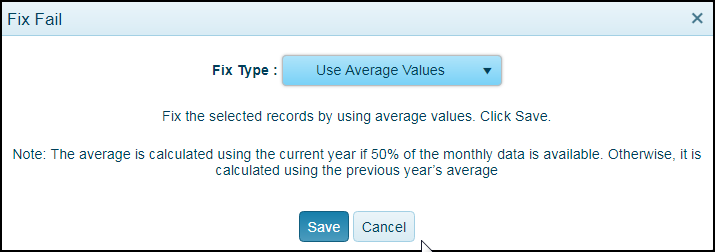
The Use Average Values option will fix the selected records using the average of the current year if 50% of the monthly data is available. Otherwise, it is calculated using the previous year’s average.
Inactive Flow Month

The Inactive Month option only applies to Flow parameters by applying “Manual No Discharge – IM” to the QAQC Comment, updating the value to 0 and preventing further QAQC checks from being performed for the selected records.
Adjust Pollutant Value

The Adjust Pollutant Value option applies to TN and TP changing the TN value to equal the sum of NH3+NO23+TON or the TP value to equal the sum of PO4+TOP.
The DMR Detail Info icon next to the facility name can provide an overview of all current values for the facility before making the change.
Adjust Species Proportion

The Adjust Species Proportion fix can only be applied to TP and TN and will adjust the values of the pollutant species proportionally, such that:
TN Diff = TN - (NH3 + TON + NO23)
Species Sum = (NH3 + NO23 + TON)
Adjusted NH3 = NH3 +/- [TN Diff * (NH3/Species Sum)]
Adjusted TON = TON +/- [TN Diff * (TON/Species Sum)]
Adjusted NO23 = NO23 +/- [TN Diff * (NO23/Species Sum)]
TP Diff = TP - (PO4 + TOP)
Species Sum = PO4 + TOP
Adjusted PO4 = PO4 +/- [TP Diff * (PO4/Species Sum)]
Adjusted TOP = TOP +/- [TP Diff * (TOP/Species Sum)]
Exception: The fix cannot be applied to TKN + NO2/NO3 = TN warnings.
For example, when TN = 6.5, NH3 = 1, TON = 2 and NO23 = 3
TN Diff = 6.5 - (1 + 2 + 3) = .5
Species Sum = (1 + 2 + 3) = 6
Adjusted NH3 = 1 + .5 * (1 / 6) = 1.0833333
Adjusted TON = 2 + .5 * (2 / 6) = 2.166666667
Adjusted NO23 = 3 + .5 * (3 / 6) = 3.25
The DMR Detail Info icon next to the facility name can provide an overview of all current values for the facility before making the change.
Using File Uploads
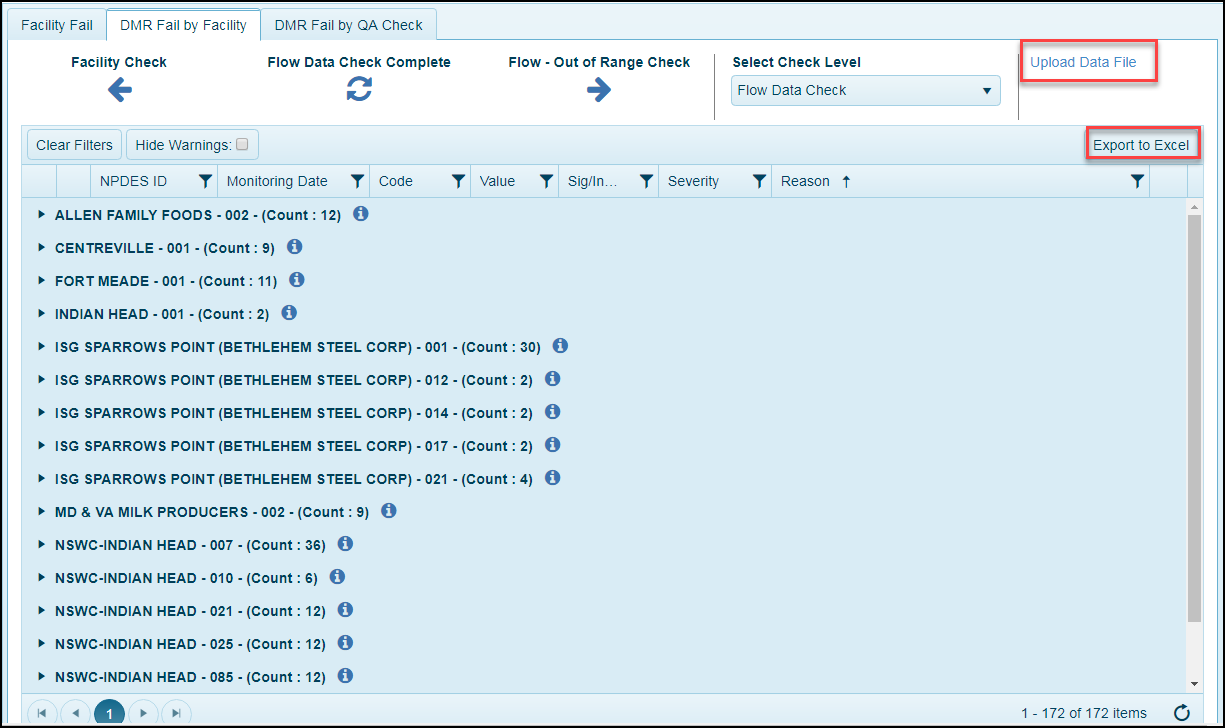
On each QAQC Check level the user has the option of downloading all the check items using the Export to Excel button, making the corrections, and then uploading the fixed data. Only a version of the file exported on the QAQC Check level can be utilized for the upload because of hidden metadata required to process the corrections. The file can be renamed but must contains the same number of rows for a successful upload.

On each QAQC Check level the user has the option of downloading all the check items using the Export to Excel button, making the corrections, and then uploading the fixed data. Only a version of the file exported on the QAQC Check level can be utilized for the upload because of hidden metadata required to process the corrections. The file can be renamed but must contains the same number of rows for a successful upload.
Until the Severity column is added to the exported file, the user can use the Reason column to identify errors which are “Value Not Found” records which must be fixed. It is easier to make Species Ratio Check level changes in the application because of the additional Adjust Pollutant Value and Adjust Species Proportion fixes available.
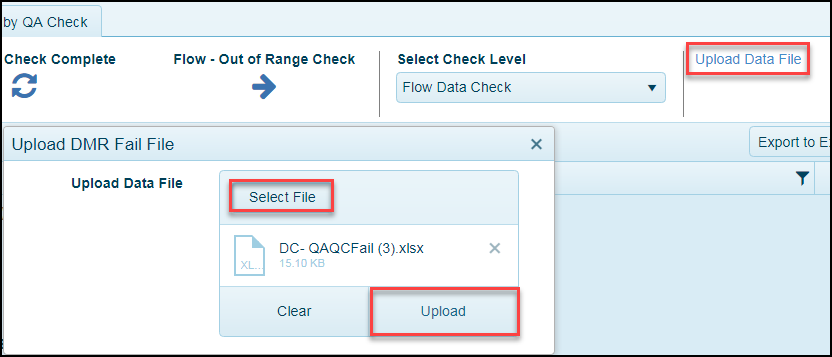
Once the file has been exported and fixed, use the Upload Data File link to open the Upload DMR Fail File pop up. Use the Select File button to select a file and then the Upload button. Some upload errors that could occur include the hidden metadata or row counts do not match.
If you only partially fix the errors in a file and then upload it, you will need to export a new file to make the next set of changes to match the modified grid at this level.

After uploading a file the only items remaining in the grid will be the records you left unchanged in the file. Re-run the level’s check (middle icon) and then Select the Hide Warnings checkbox to verify no outstanding errors before running the next QAQC Check level (right icon).
Trend Report

A Trend Report can only be run on data sets with the QAQC Complete status acquired after running all of the data checks. The Checks link on the Data Set Page will open the QAQC Check page where the Trend Report link is available when it has thus status.

The Trend Report allows users to compare the projected TN, TP and TSS loads from last year against values in the current data set along with a percent change between the two values.
| Trend Report Columns | Trend Report Columns | Trend Report Columns |
|---|---|---|
| State Code | TN_Load | Projected_TSS_Load |
| NPDES ID | TNPercentChange | TSS_Load |
| Facility Name | Projected_TP_Load | TSSPercentChange |
| Sig/Insig | TP_Load | |
| Projected_TN_Load | TPPercentChange |
Reports
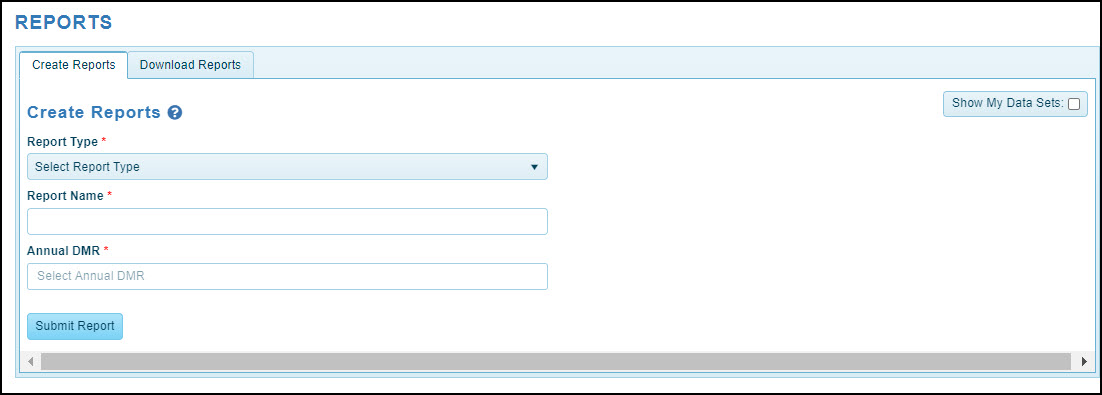
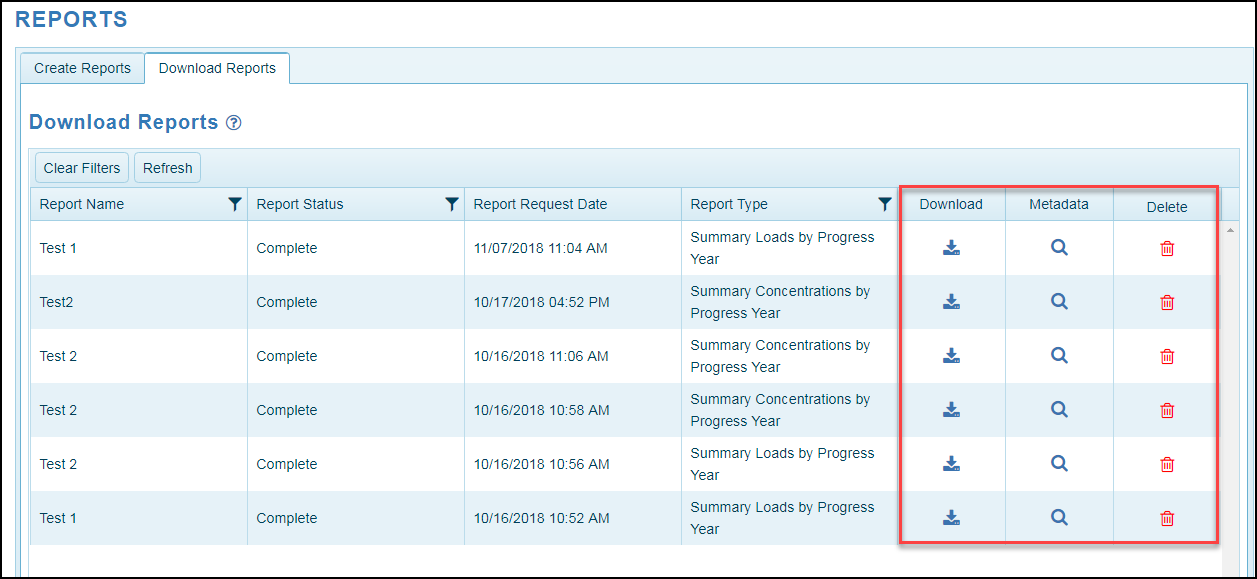
The Point Source application generates five reports: Active Facilities-Outfalls, Annual DMR Datasets, Five Year Trends, Summary Concentrations, and Summary Loads. Once a request is submitted the user can access the report from the Download Reports tab or the link in the email sent upon the report’s completion. The direct download link in the email will only be active for 30 days.
Active Facilities-Outfalls
This report provides a list of the active facility-outfall combinations for a given state. After naming the report, the user will select a state, significant/insignificant status, and discharge type for the report output. Only one Annual DMR dataset can be selected for this report.
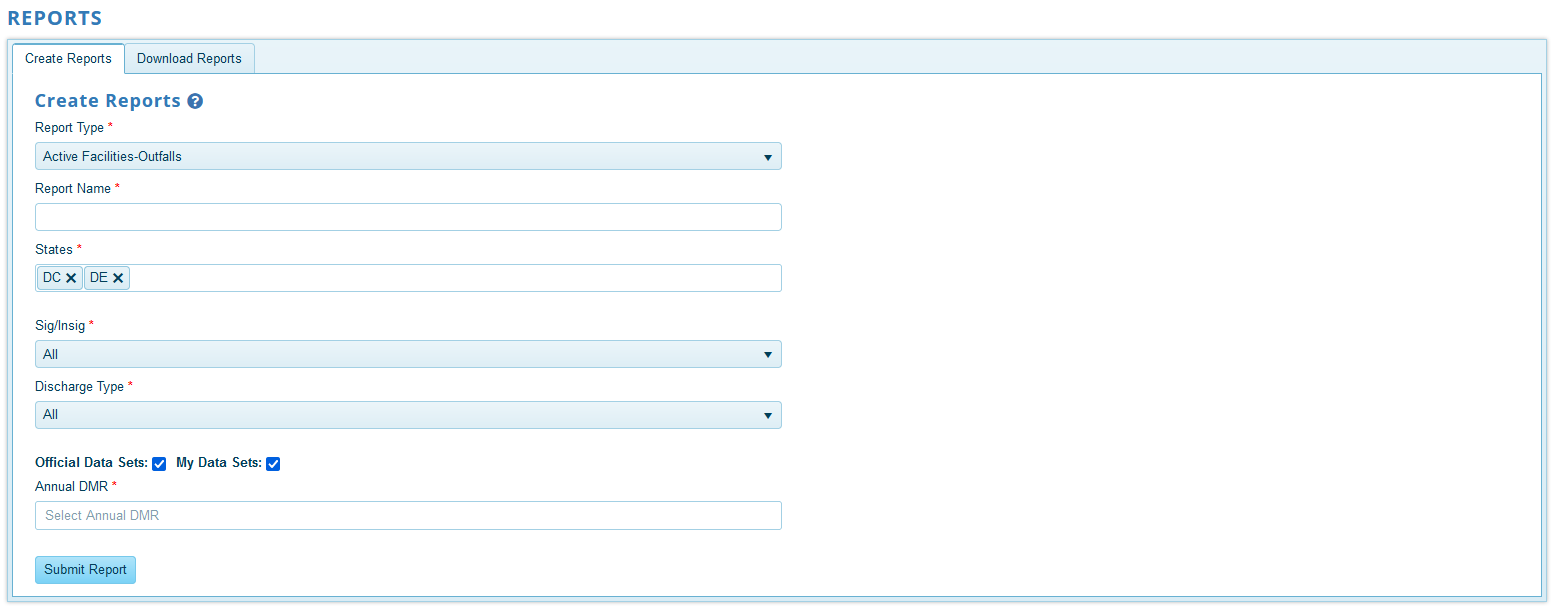
The user can choose to limit their selection of datasets to choose by checking and unchecking the Official Datasets and My Datasets boxes.
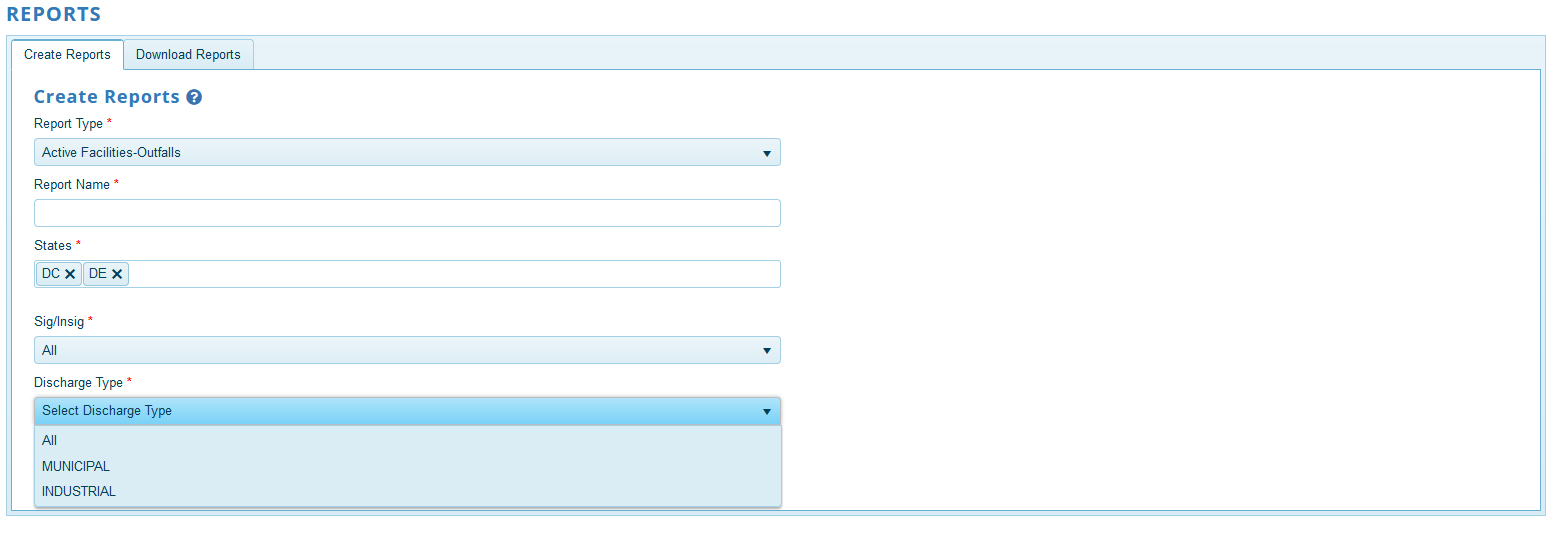
Annual DMR Dataset
This report provides the complete DMR dataset for any dataset that is QAQC complete. It includes facility, outfall, flow, and concentration for each reporting month and reporting parameter, as well as the parameter source information. After naming the report, the user will select a state and an Annual DMR dataset. Only one Annual DMR dataset can be selected for this report. The user can choose to limit their selection of datasets to choose by checking and unchecking the Official Datasets and My Datasets boxes.

Five Year Trend Report
This report provides the summary flow and loads of TN, TP, and TSS for the selected dataset and the official data for the four years prior to the year of the selected dataset. The report also provides a percent change for flow and loads between each year. After naming the report, the user will select a state, significant/insignificant status, and discharge type for the report output. Only one Annual DMR dataset can be selected for this report. The user can choose to limit their selection of datasets to choose by checking and unchecking the Official Datasets and My Datasets boxes.

Summary Concentrations
The Summary Concentrations by Progress Year will include the monthly Flow, TN, TP and TSS loads organized by the data set(s) and broken down by facility. This will allow the user to compare monthly data for specific facilities over multiple years in a single report. After naming the report, the user will select a state, significant/insignificant status, and discharge type for the report output. The user can select multiple Annual DMR datasets for this report. The user can choose to limit their selection of datasets to choose by checking and unchecking the Official Datasets and My Datasets boxes.
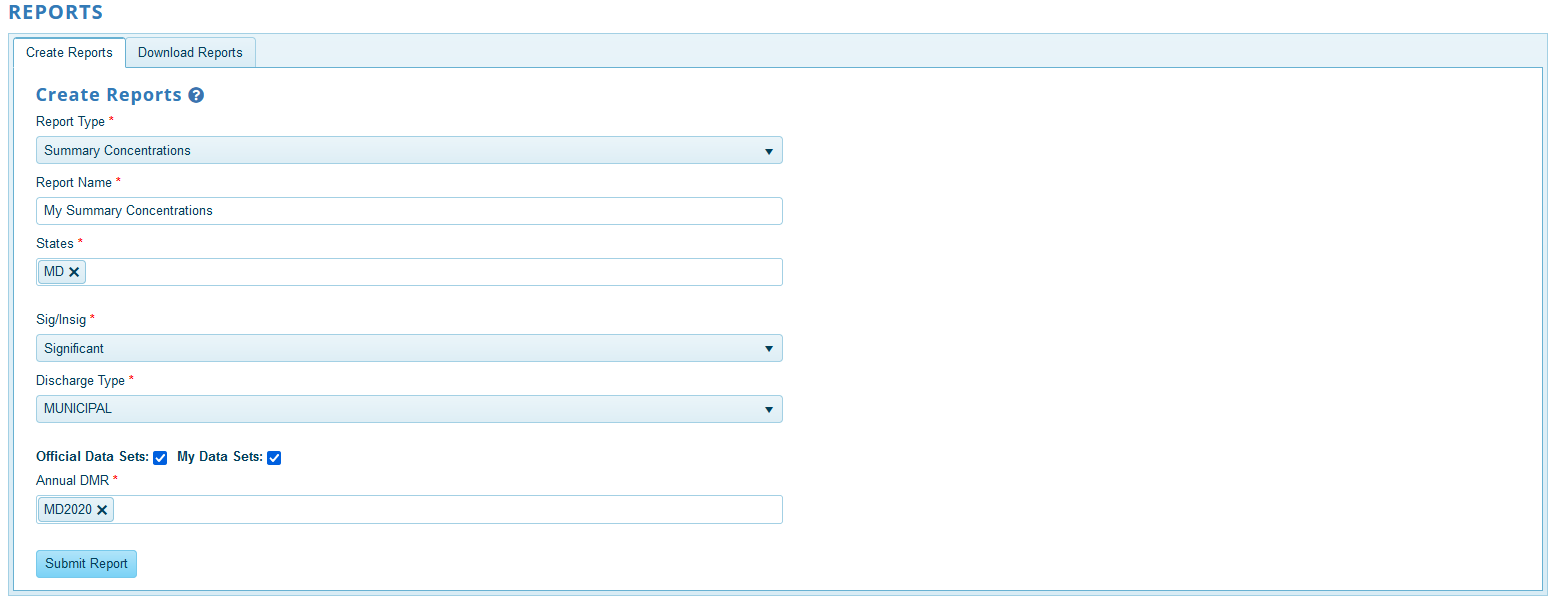
Summary Loads
The Summary Loads by Progress Year Report will include the yearly TN, TP and TSS loads organized by the data set(s) and broken down by facility. This allows the user to compare yearly data for specific facilities for multiple years in a single report. After naming the report, the user will select a state, significant/insignificant status, and discharge type for the report output. The user can select multiple Annual DMR datasets for this report. The user can choose to limit their selection of datasets to choose by checking and unchecking the Official Datasets and My Datasets boxes.
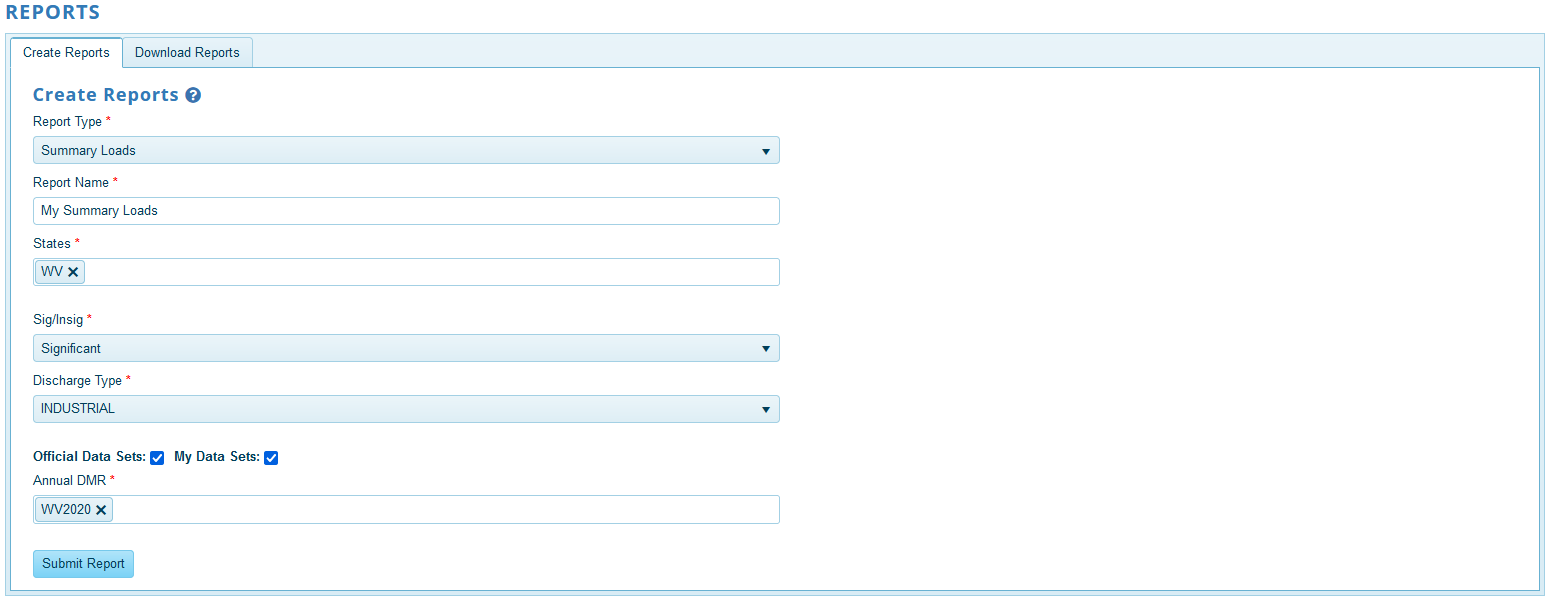
Non-Wastewater

The user can access the Non-Wastewater Data by clicking on the NON-WASTEWATER link in the top banner.
The Non-Wastewater Data provides users with a tab for each Non-Wastewater data associated with a State and a Year. The user can use the provided Templates to complete the non-wastewater point source data.
From this page the user can Upload Data file and export the Non-Wastewater Data to Excel.
Flow Splits
Usually the load for a wastewater treatment plant is attributed to the lrseg that the outfall in. Some wastewater treatment plants process waste for more than one county so we need to split the load. In these cases, the load is attributed to the land segment (FIPS with N,H or D added) of the county + the river segment that the outfall is in. In some cases these result in non-physical lrsegs because the county is not in the river segment that the outfall is in. The easiest example of this is Blue Plains. Outfall 002 has 5 land river segments assigned to it - 1 in DC, 2 in MD, and 2 in VA. In order for us to assign the share of the load appropriately in the model we need to assign the fraction of the flow that should be assigned to each land river segment.
Large Septic Systems
A septic system is considered a large capacity septic system if it receives solely sanitary waste either from multiple dwellings or from a non-residential establishment and the system has the capacity to serve 20 or more persons per day. Volume and concentration are reported. We differentiate between residential and commercial systems. For residential systems the population served is also reported so that this population can be removed from the population for the single family unit systems in the model.
Spray Irrigation
Spray irrigation is a method for disposing of secondary treated wastewater by spraying it on the land surface. We differentiate between ag and urban based on whether it is applied to agricultural or developed land.
New User
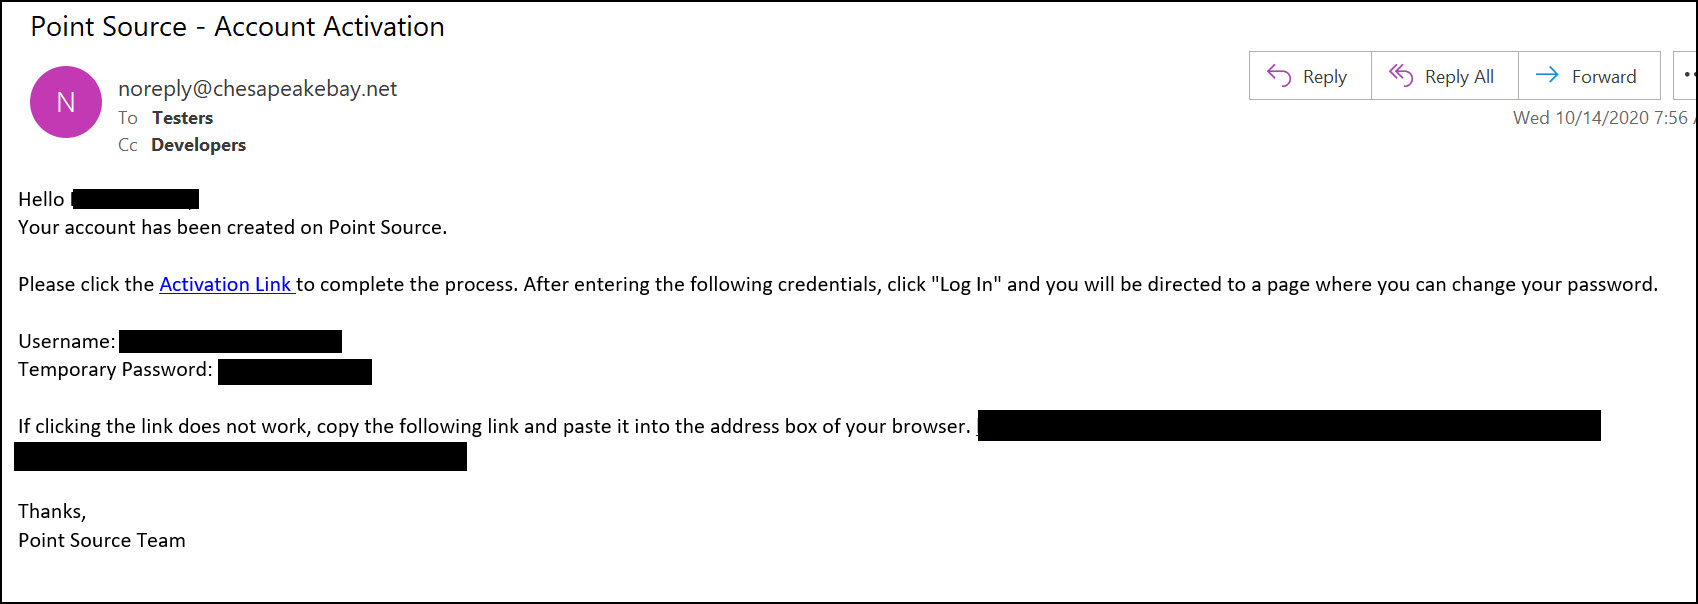
Once a request for a Point Source account has been approved, an Account Activation email will be sent that contains the user's username, temporary password and an Activation link. Upon logging in for the first time the user will need to change their password by clicking their username at the top right of any page to open the Manage User Profile page. Click the Change Password link to open the Change Password page and create a permanent password.
.
How To
The How To link on the top menu bar provides access to the Point Source documentation. The TOC on the left side of the documentation provides quick access to specific topics within the documentation.
About
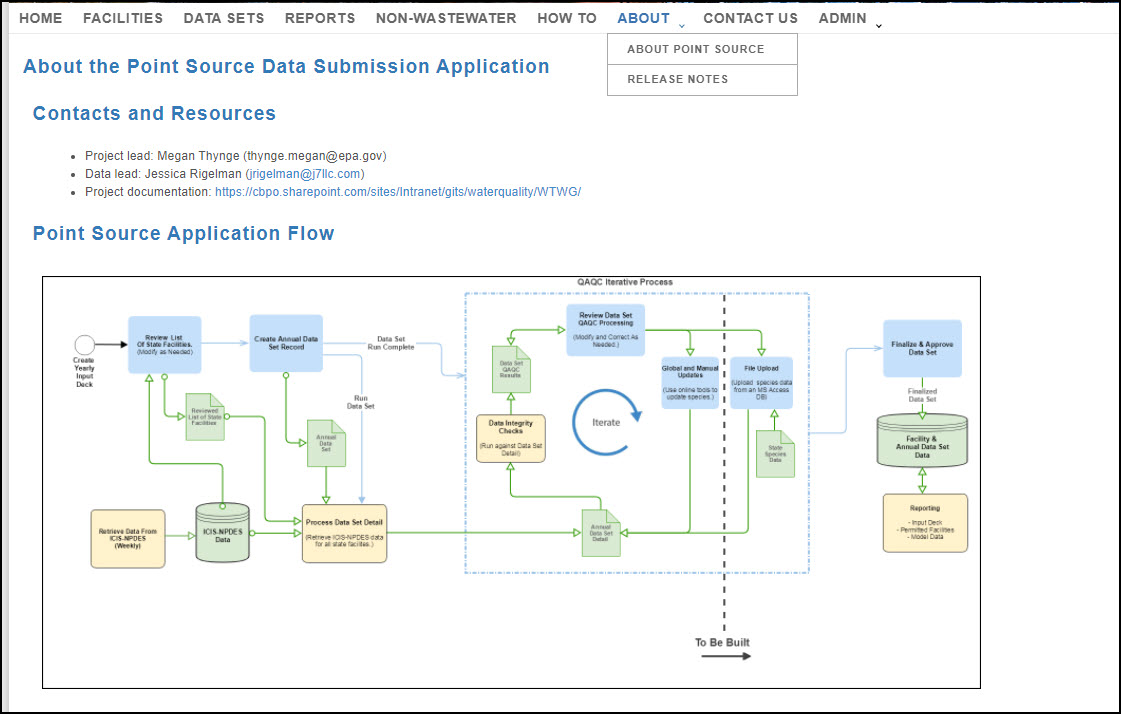
The About link on the top menu bar provides access to both the About Point Source and Release Notes pages. About Point Source contains contact information for the application as well as a breakdown of the Data Set Rules uses to explain the ICIS-NPDES parameter codes utilized by the application as well as the unit conversions being performed.
Release Notes
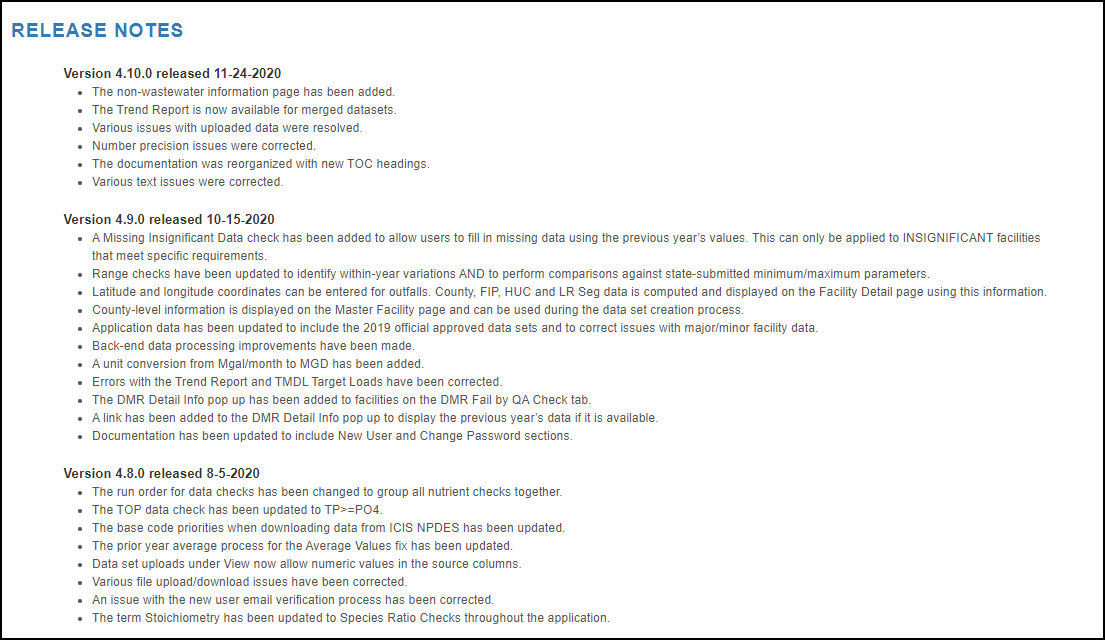
The Release Notes are a change history of the modifications that have been made to the application over time. If the user hasn't used the application for a long period of time, they may want to review the Notes to learn about new features and fixes that have been applied.
.
.
ChangePassword
To change your password while logged in, click the username link in the top right corner of any page to open the Manage User Profile page.
 .
.
Click the Change your password link to open the Change Password page.
 .
.
Supply both the old and new passwords to complete the process..
 .
.
..
.
.